Fig. A.8
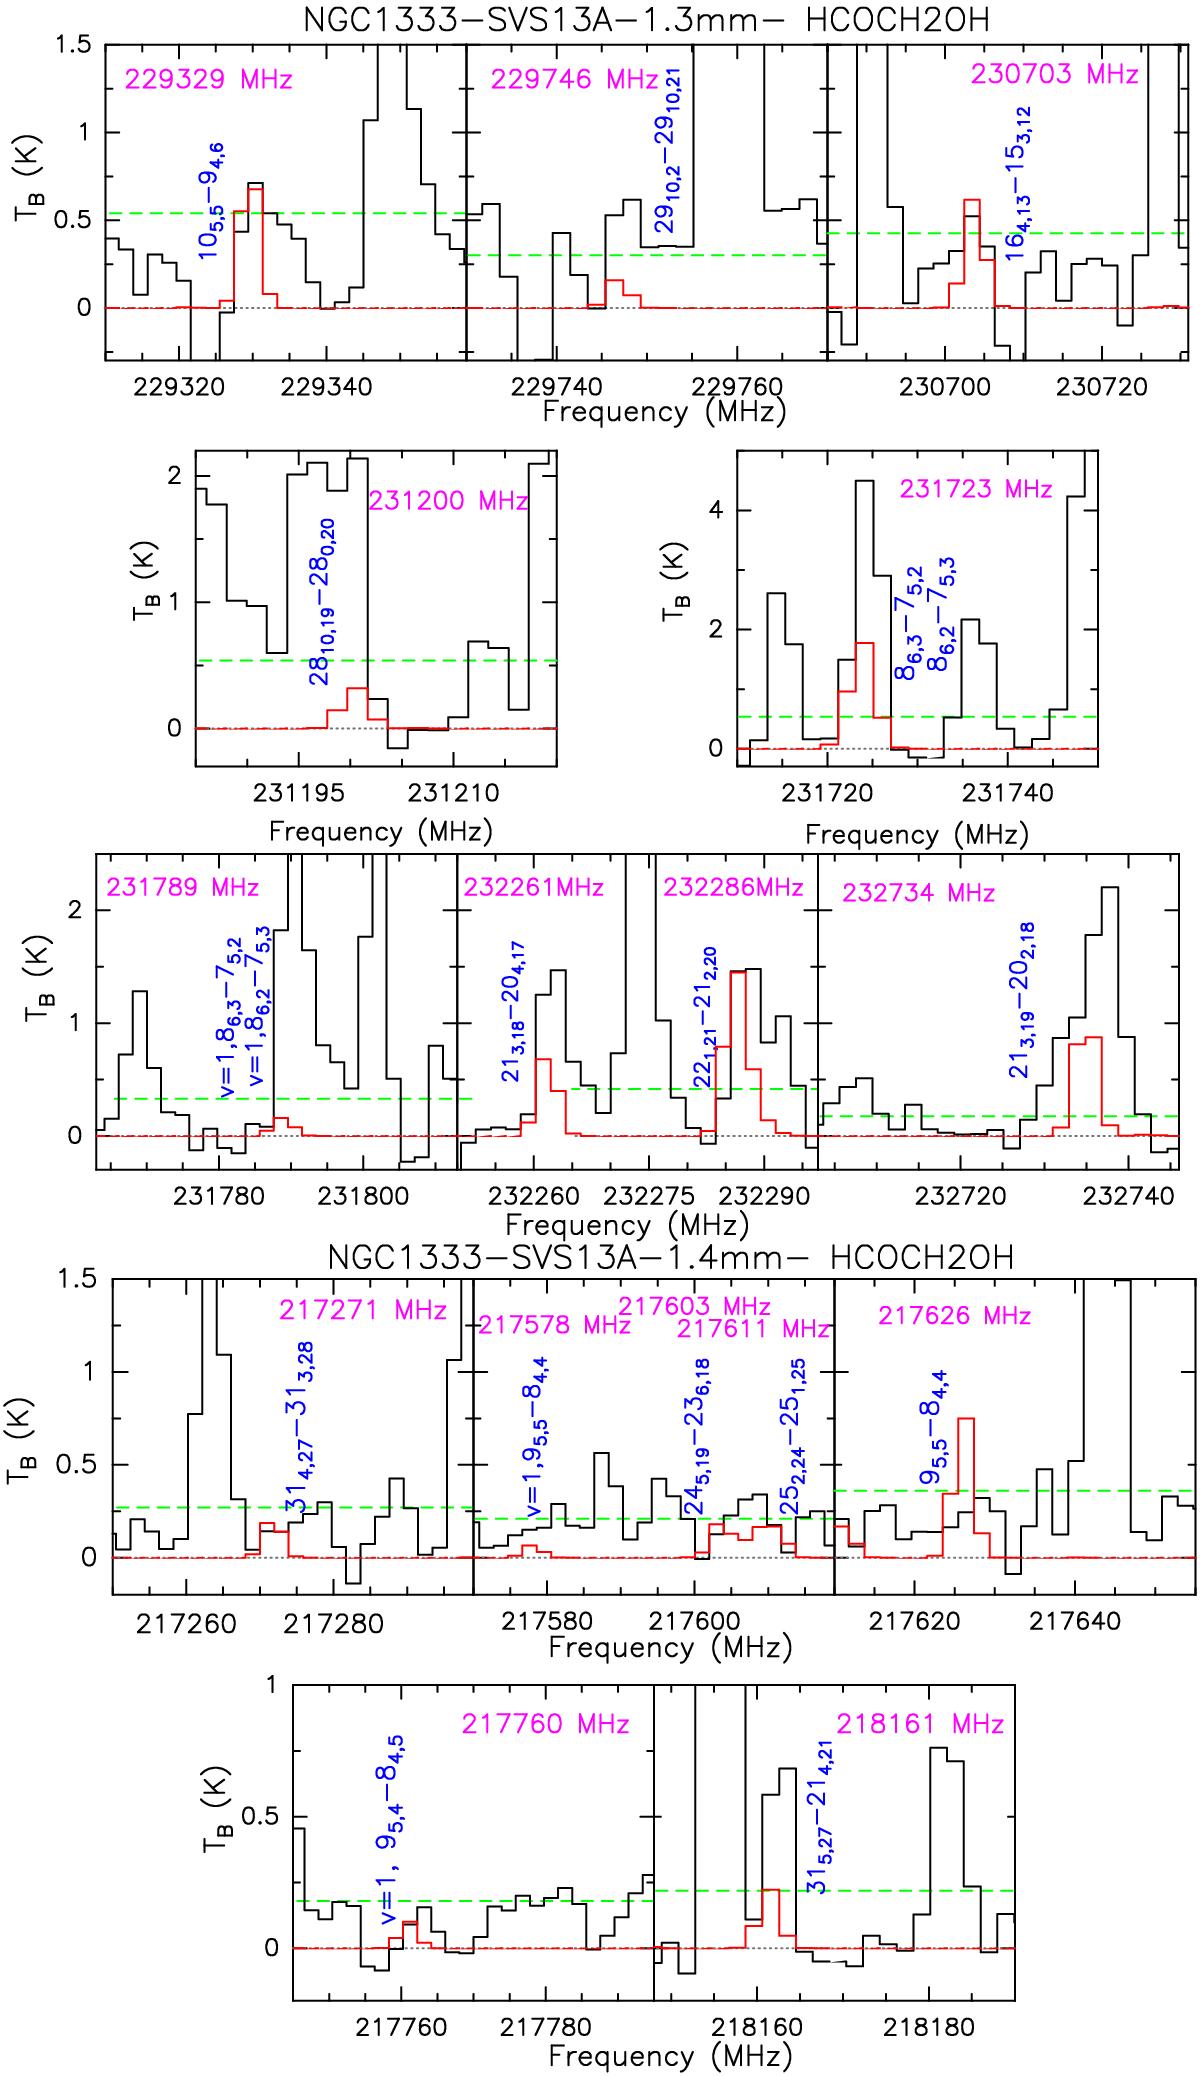
Glycolaldehyde emission lines (in TB scale) observed in the 1.3 mm and 1.4 mm spectral windows towards NGC 1333-SVS13A and excluded from the LTE analysis because of severe blending with other emission lines. The horizontal green dotted lines show the 3σ level. In blue we mark the glycolaldehyde transitions. The red line shows the synthetic spectrum obtained with the GILDAS-Weeds package (Maret et al. 2011) and assuming the rotation diagram solutions (see Fig. 3).
Current usage metrics show cumulative count of Article Views (full-text article views including HTML views, PDF and ePub downloads, according to the available data) and Abstracts Views on Vision4Press platform.
Data correspond to usage on the plateform after 2015. The current usage metrics is available 48-96 hours after online publication and is updated daily on week days.
Initial download of the metrics may take a while.