Fig. 2
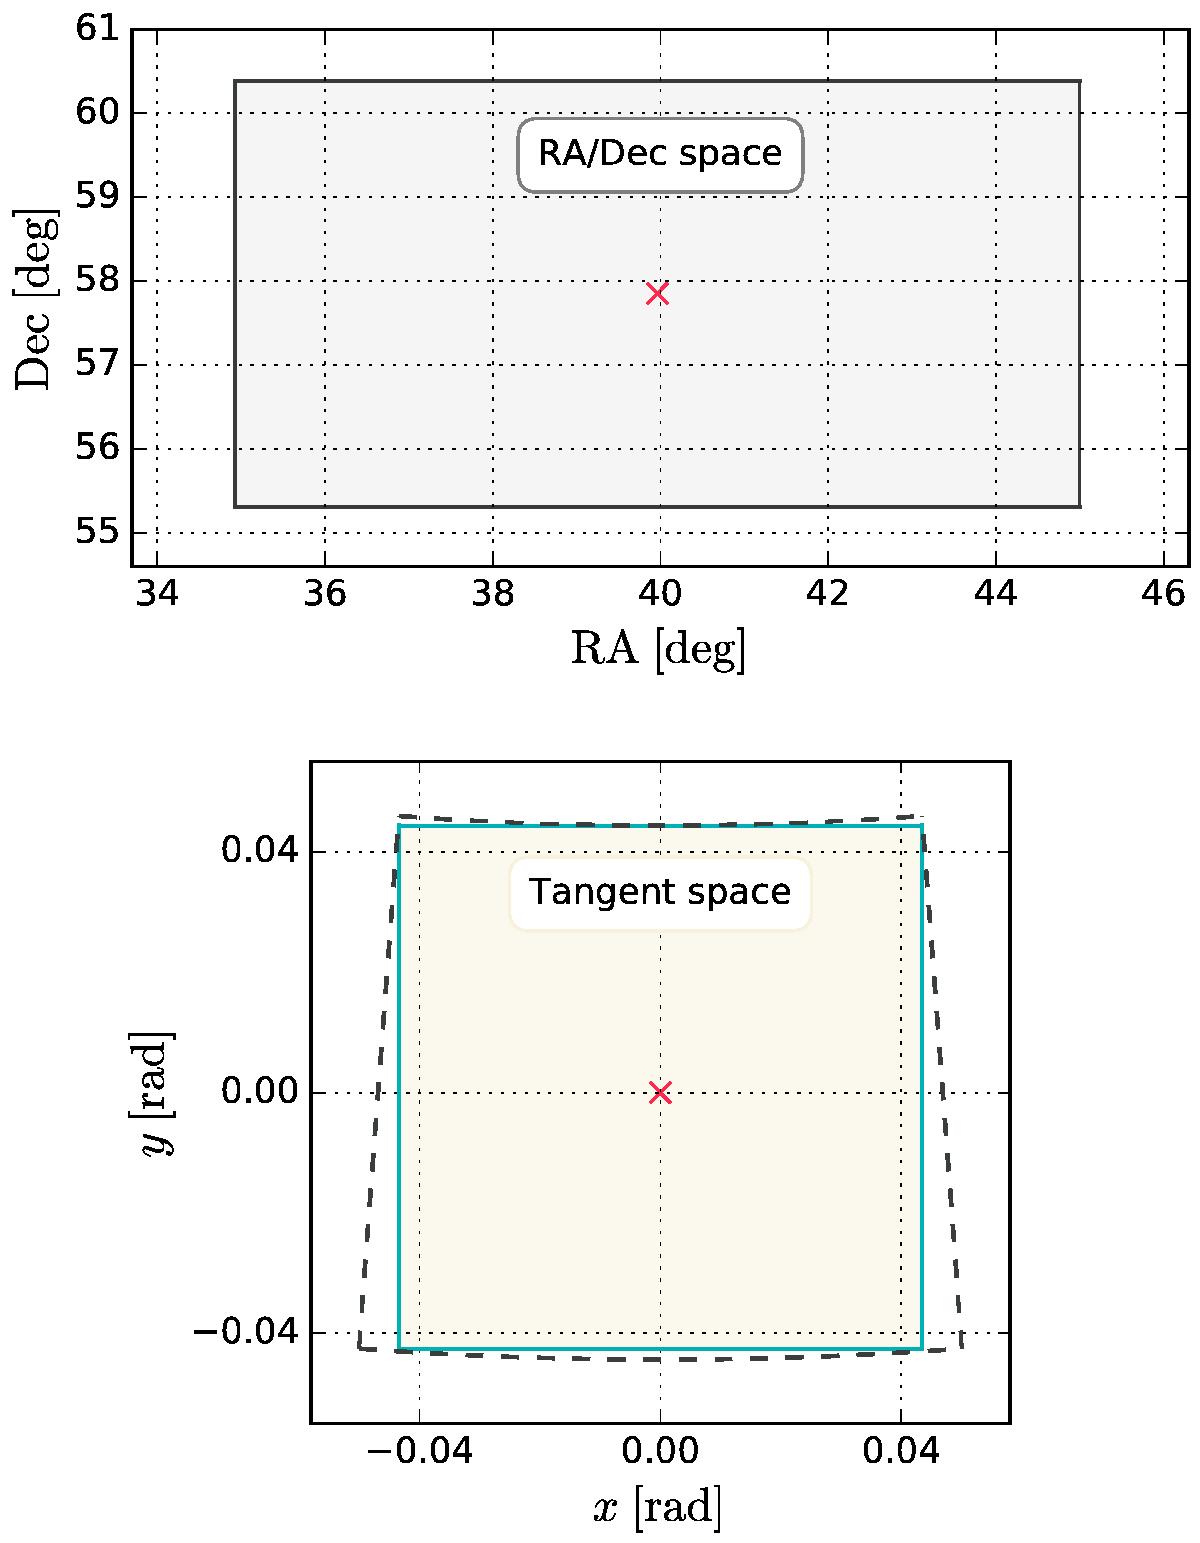
Example of our patch extraction and projection scheme for MICE. The upper panel shows the original extent of the patch, which lies within 34.9° ≤ RA ≤ 45.0°, 55.3° ≤ Dec ≤ 60.4°. This area is projected into the region enclosed by the dashed line in the lower panel of the tangent space. The bounded inner square represents the 25 deg2 area for which we generate the multiscale maps and compute peak histograms.
Current usage metrics show cumulative count of Article Views (full-text article views including HTML views, PDF and ePub downloads, according to the available data) and Abstracts Views on Vision4Press platform.
Data correspond to usage on the plateform after 2015. The current usage metrics is available 48-96 hours after online publication and is updated daily on week days.
Initial download of the metrics may take a while.