Free Access
Fig. 8
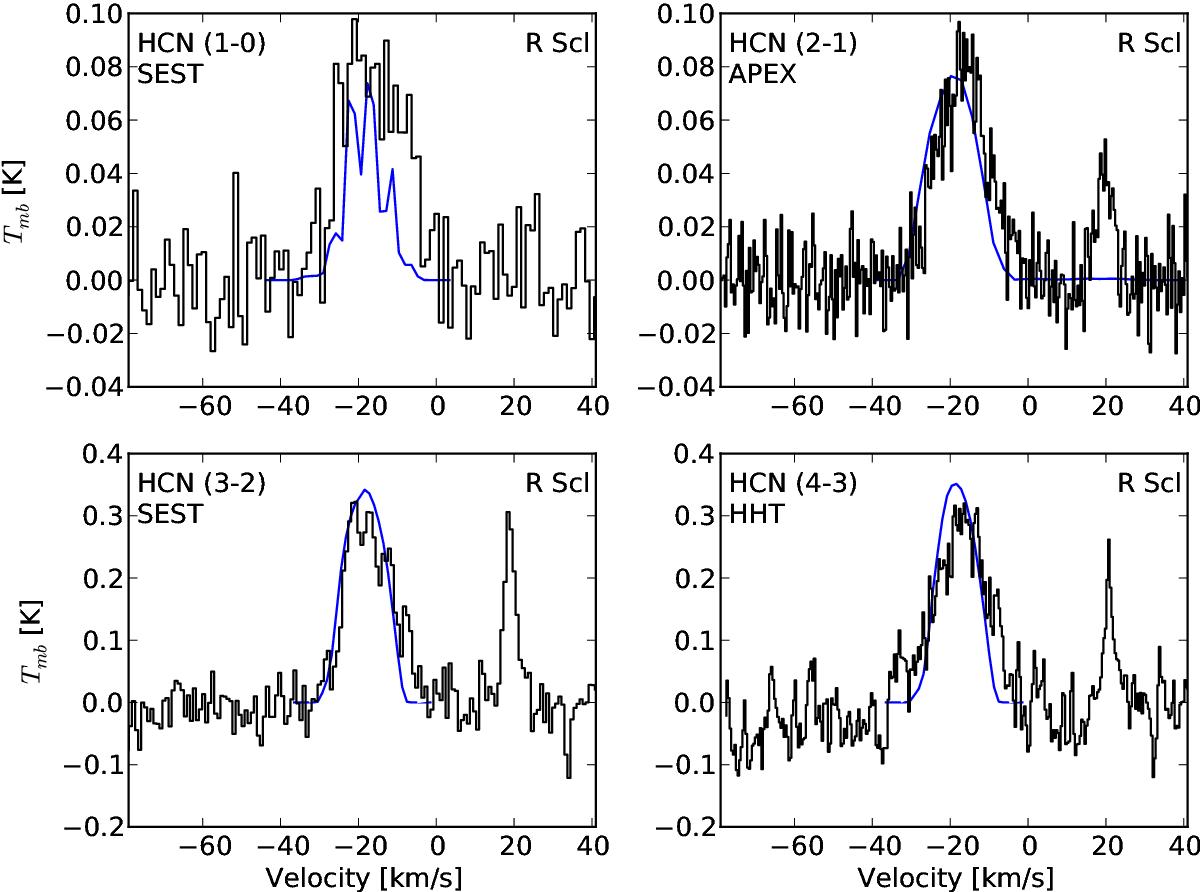
Line emission of H12CN towards R Scl (black) overlaid with the best-fitting model (blue). Molecular transitions and the telescope used to get data are written in each panel. Second peaks in J= 2−1, 3−2, 4−3 transitions are due to maser emission in the (011c0) vibrational state.
Current usage metrics show cumulative count of Article Views (full-text article views including HTML views, PDF and ePub downloads, according to the available data) and Abstracts Views on Vision4Press platform.
Data correspond to usage on the plateform after 2015. The current usage metrics is available 48-96 hours after online publication and is updated daily on week days.
Initial download of the metrics may take a while.