Fig. 5
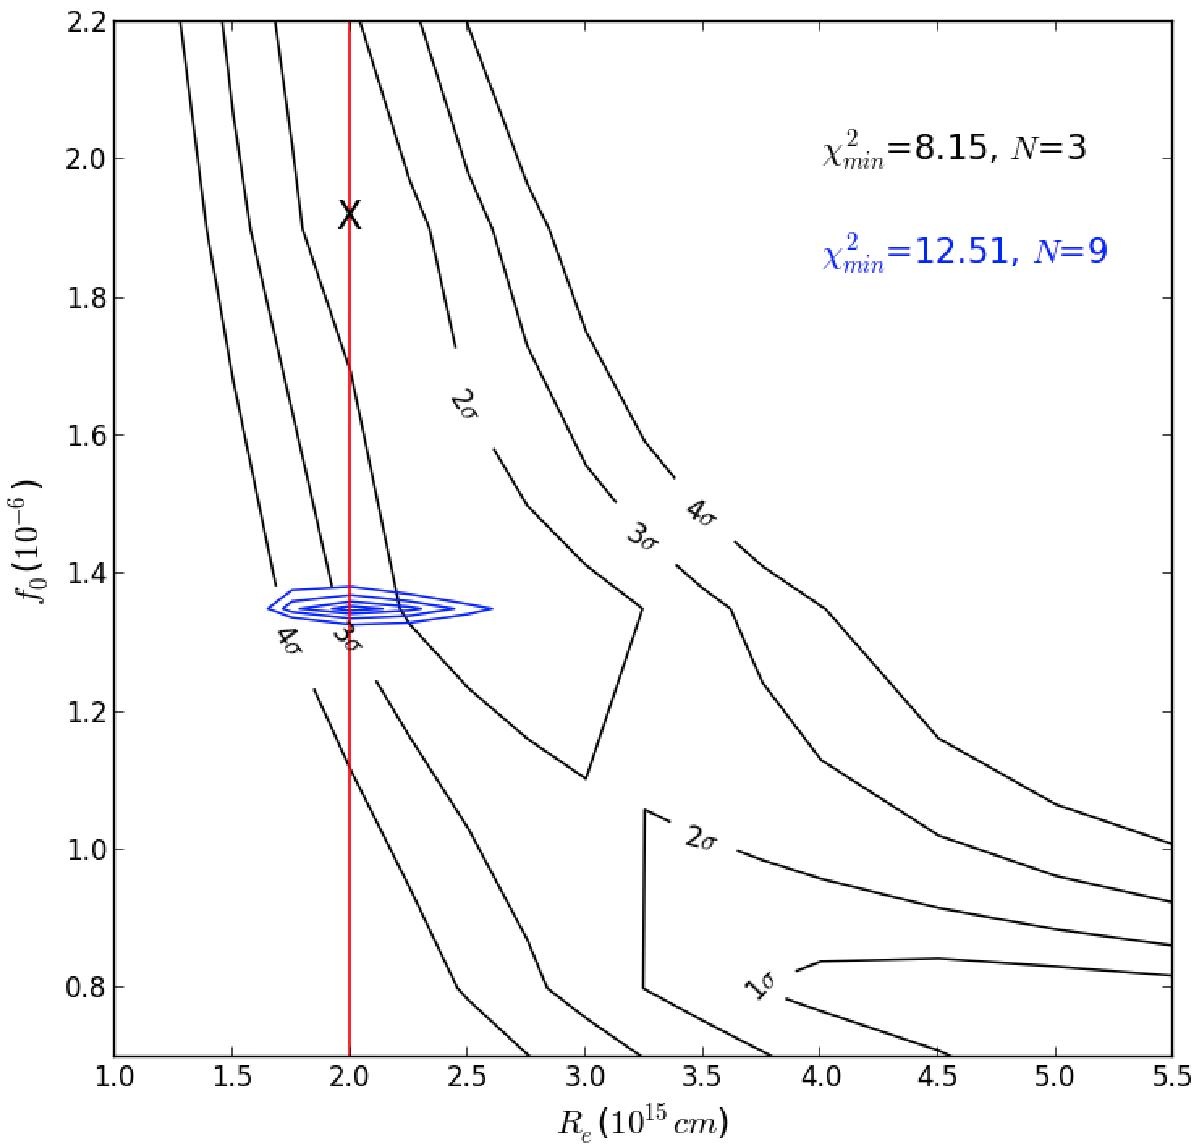
Two ![]() maps calculated using the average intensities at radial offset points from H13CN(4−3) ALMA observations (blue), and the total intensities of H13CN(2−1, 3−2, 4−3) (black). The min
maps calculated using the average intensities at radial offset points from H13CN(4−3) ALMA observations (blue), and the total intensities of H13CN(2−1, 3−2, 4−3) (black). The min ![]() values and the number of observational constraints that are used in the calculations are written. Contours are plotted at the 1–4σ standard deviation levels from the minimum
values and the number of observational constraints that are used in the calculations are written. Contours are plotted at the 1–4σ standard deviation levels from the minimum ![]() . The best-fitting model for H13CN is shown by a black X.
. The best-fitting model for H13CN is shown by a black X.
Current usage metrics show cumulative count of Article Views (full-text article views including HTML views, PDF and ePub downloads, according to the available data) and Abstracts Views on Vision4Press platform.
Data correspond to usage on the plateform after 2015. The current usage metrics is available 48-96 hours after online publication and is updated daily on week days.
Initial download of the metrics may take a while.