Fig. 6
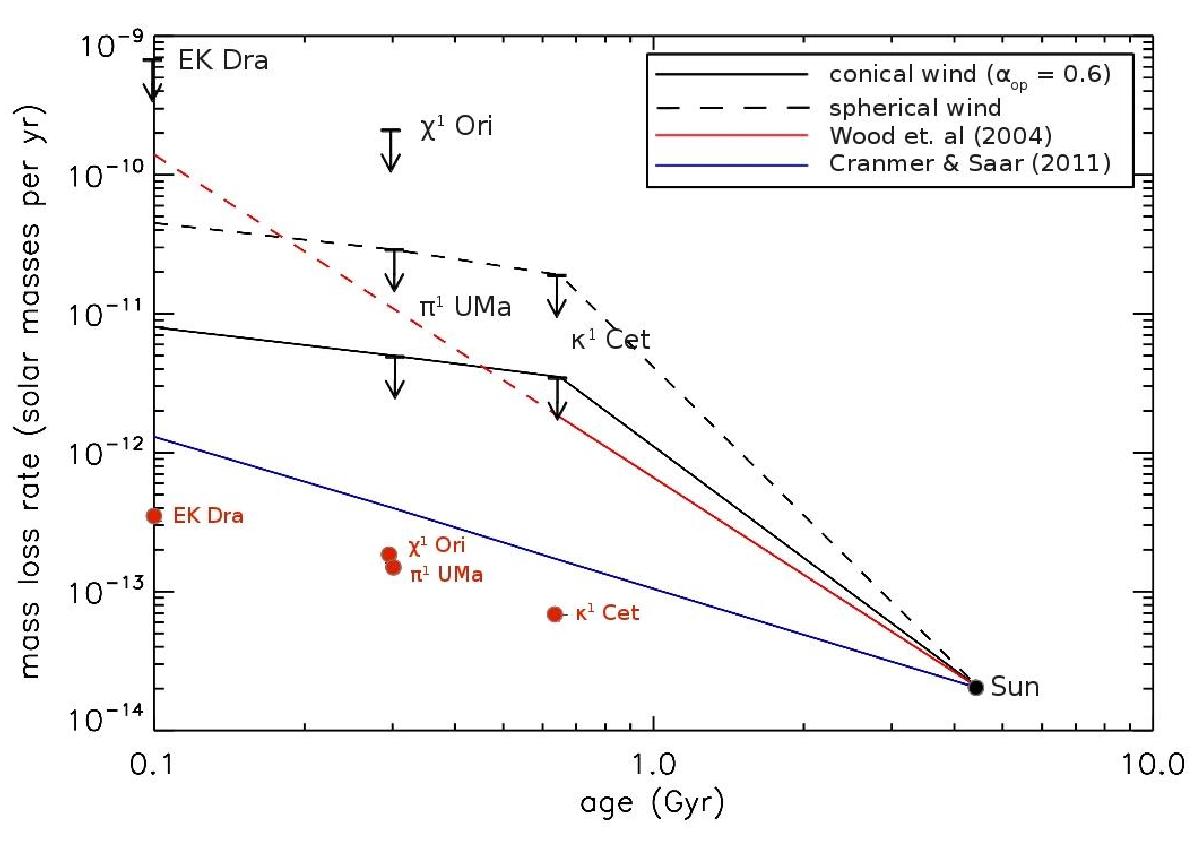
Mass loss evolution described by the non-detections π1 UMa and κ1 Cet at 0.3 and 0.65 Gyr, respectively, and the present Sun at 4.5 Gyr, shown as a black solid line assuming a conical wind with αop = 0.6 (Model A, solid line). The mass loss rates of all sources including EK Dra and χ1 Ori are determined from their observational flux densities in Ku-band and opening angles of 40°. For Models B and C, this evolution would lie below the solid line implying a lower upper limit of the solar mass. The black dashed line shows the evolution assuming a spherically symmetric wind. For EK Dra and χ1 Ori only the mass loss rates of spherically symmetric winds are shown, whereas for π1 UMa and κ1 Cet, mass loss rates of symmetric and conical winds, respectively, are shown. The red circles are the mass loss rate estimates using rotational evolution model calculations described in Johnstone et al. (2015b). The red line shows the result of Wood (2004), where the dashed line indicates the age region where the power law fails. Cranmer & Saar (2011) also estimate a mass loss rate versus time; this fit is shown as the blue solid line.
Current usage metrics show cumulative count of Article Views (full-text article views including HTML views, PDF and ePub downloads, according to the available data) and Abstracts Views on Vision4Press platform.
Data correspond to usage on the plateform after 2015. The current usage metrics is available 48-96 hours after online publication and is updated daily on week days.
Initial download of the metrics may take a while.