Fig. 4
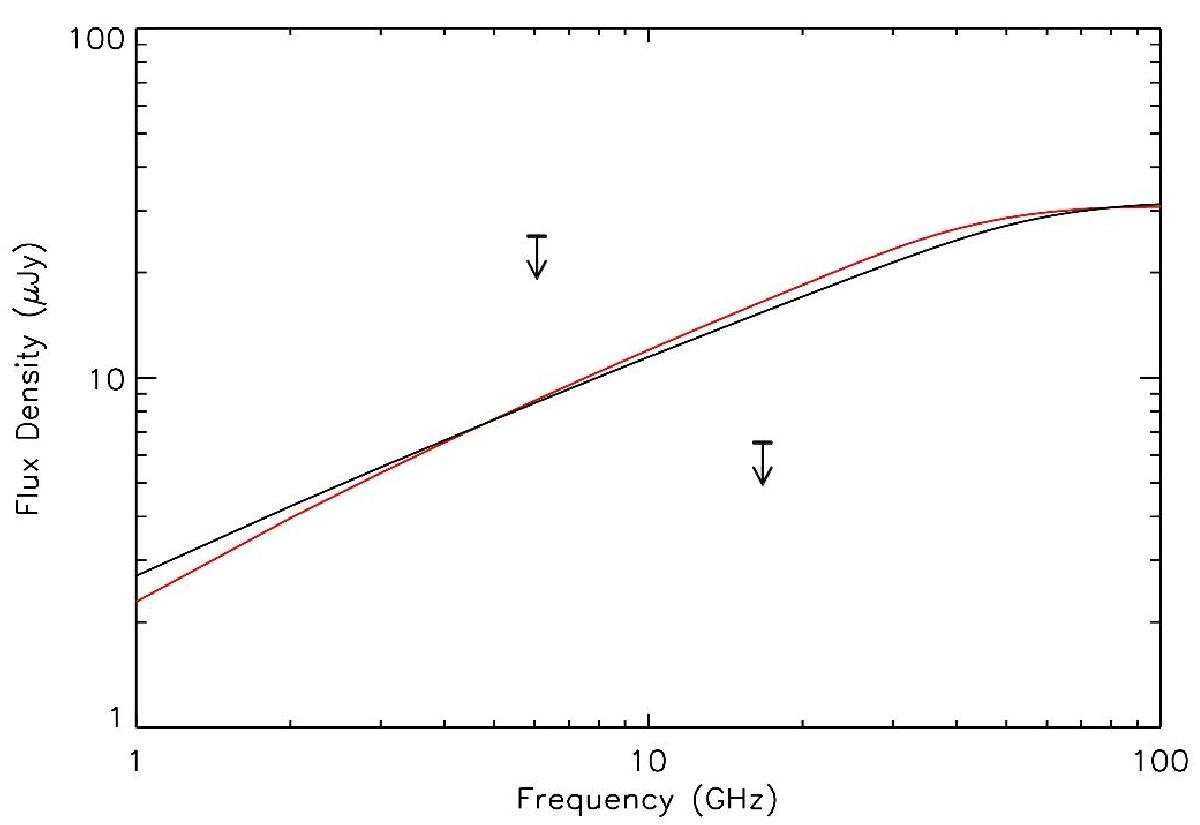
Example solution (for arbitrary mass loss rate) of the radiative transfer equation assuming a non-constant temperature, shown in red. The black line represents the result for the constant temperature solution. The initial temperature is set to T = 106 K in both cases. The density is n = 2 × 1010 cm-3. The difference in both spectra is not strongly pronounced. The “peak” at lower frequencies in the red curve results from numerical issues. The arrows mark the upper limits of the observational radio fluxes of π1 UMa in both frequency bands.
Current usage metrics show cumulative count of Article Views (full-text article views including HTML views, PDF and ePub downloads, according to the available data) and Abstracts Views on Vision4Press platform.
Data correspond to usage on the plateform after 2015. The current usage metrics is available 48-96 hours after online publication and is updated daily on week days.
Initial download of the metrics may take a while.