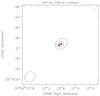
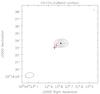
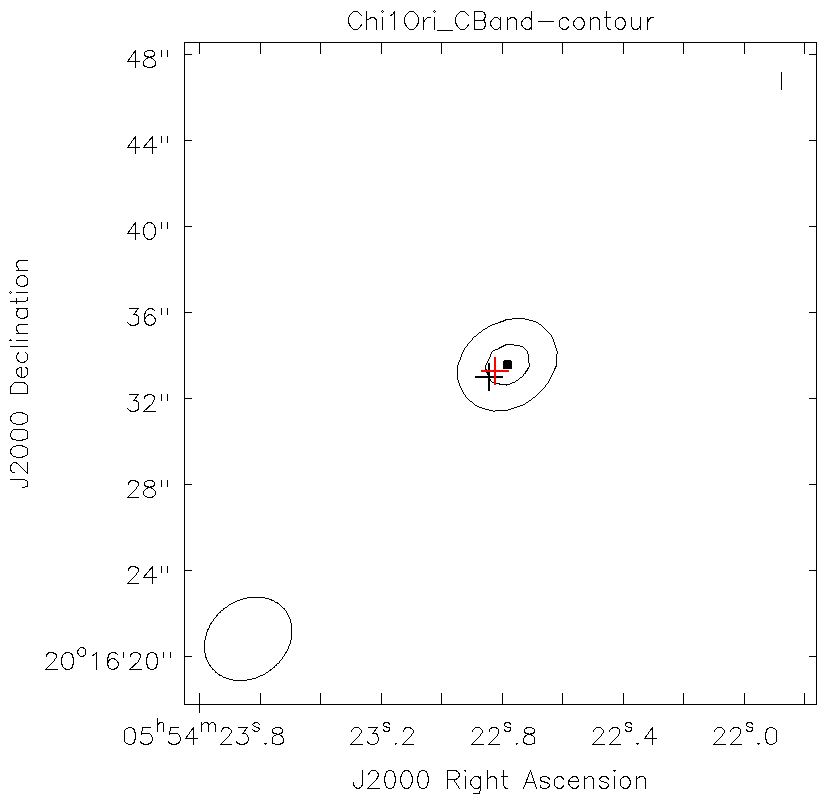
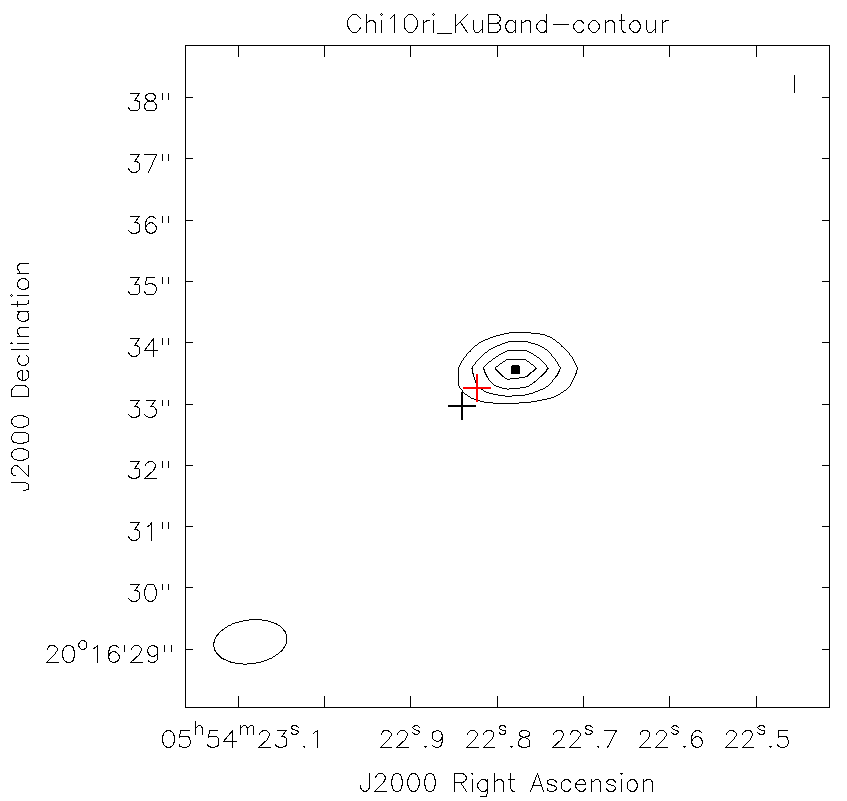
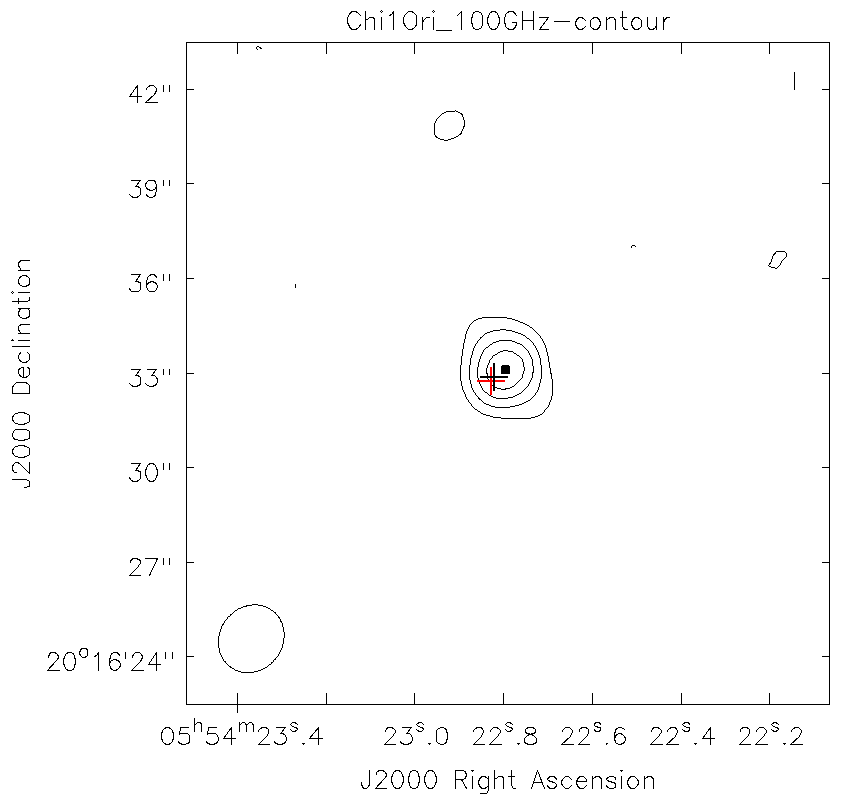
Fig. 2
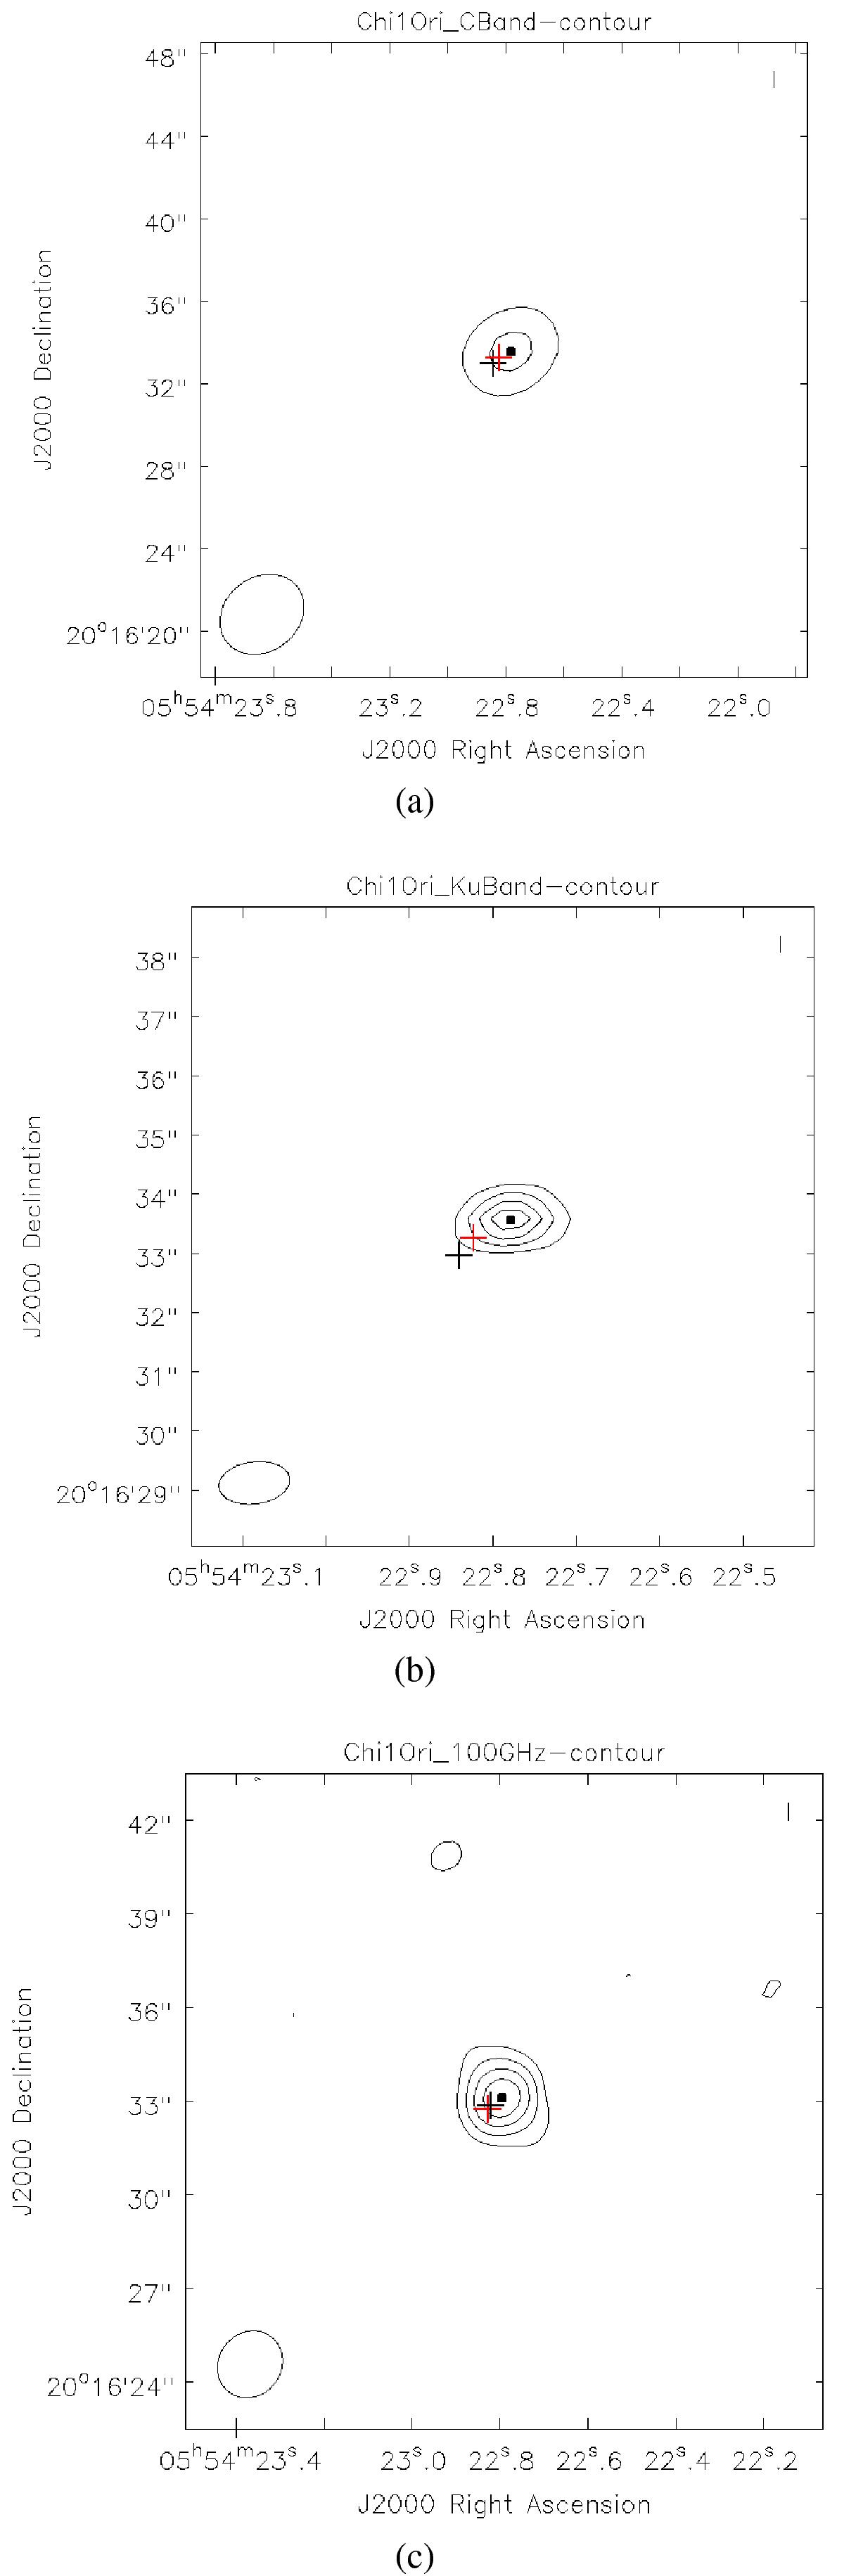
χ1 Ori in a) C-band with contour levels [0.2, 0.4, 0.6, 0.8] · 223 μJy; b) Ku-band with [0.2, 0.4, 0.6, 0.8] · 106.6 μJy; and c) for ALMA at 100 GHz with [0.2, 0.4, 0.6, 0.8] · 108 μJy. The black dot represents the coordinates calculated from the Gaussian fit. The red cross marks the position of the companion χ1 Ori B and the black cross the corrected coordinates of the main target χ1 Ori.
Current usage metrics show cumulative count of Article Views (full-text article views including HTML views, PDF and ePub downloads, according to the available data) and Abstracts Views on Vision4Press platform.
Data correspond to usage on the plateform after 2015. The current usage metrics is available 48-96 hours after online publication and is updated daily on week days.
Initial download of the metrics may take a while.