Free Access
Fig. 9
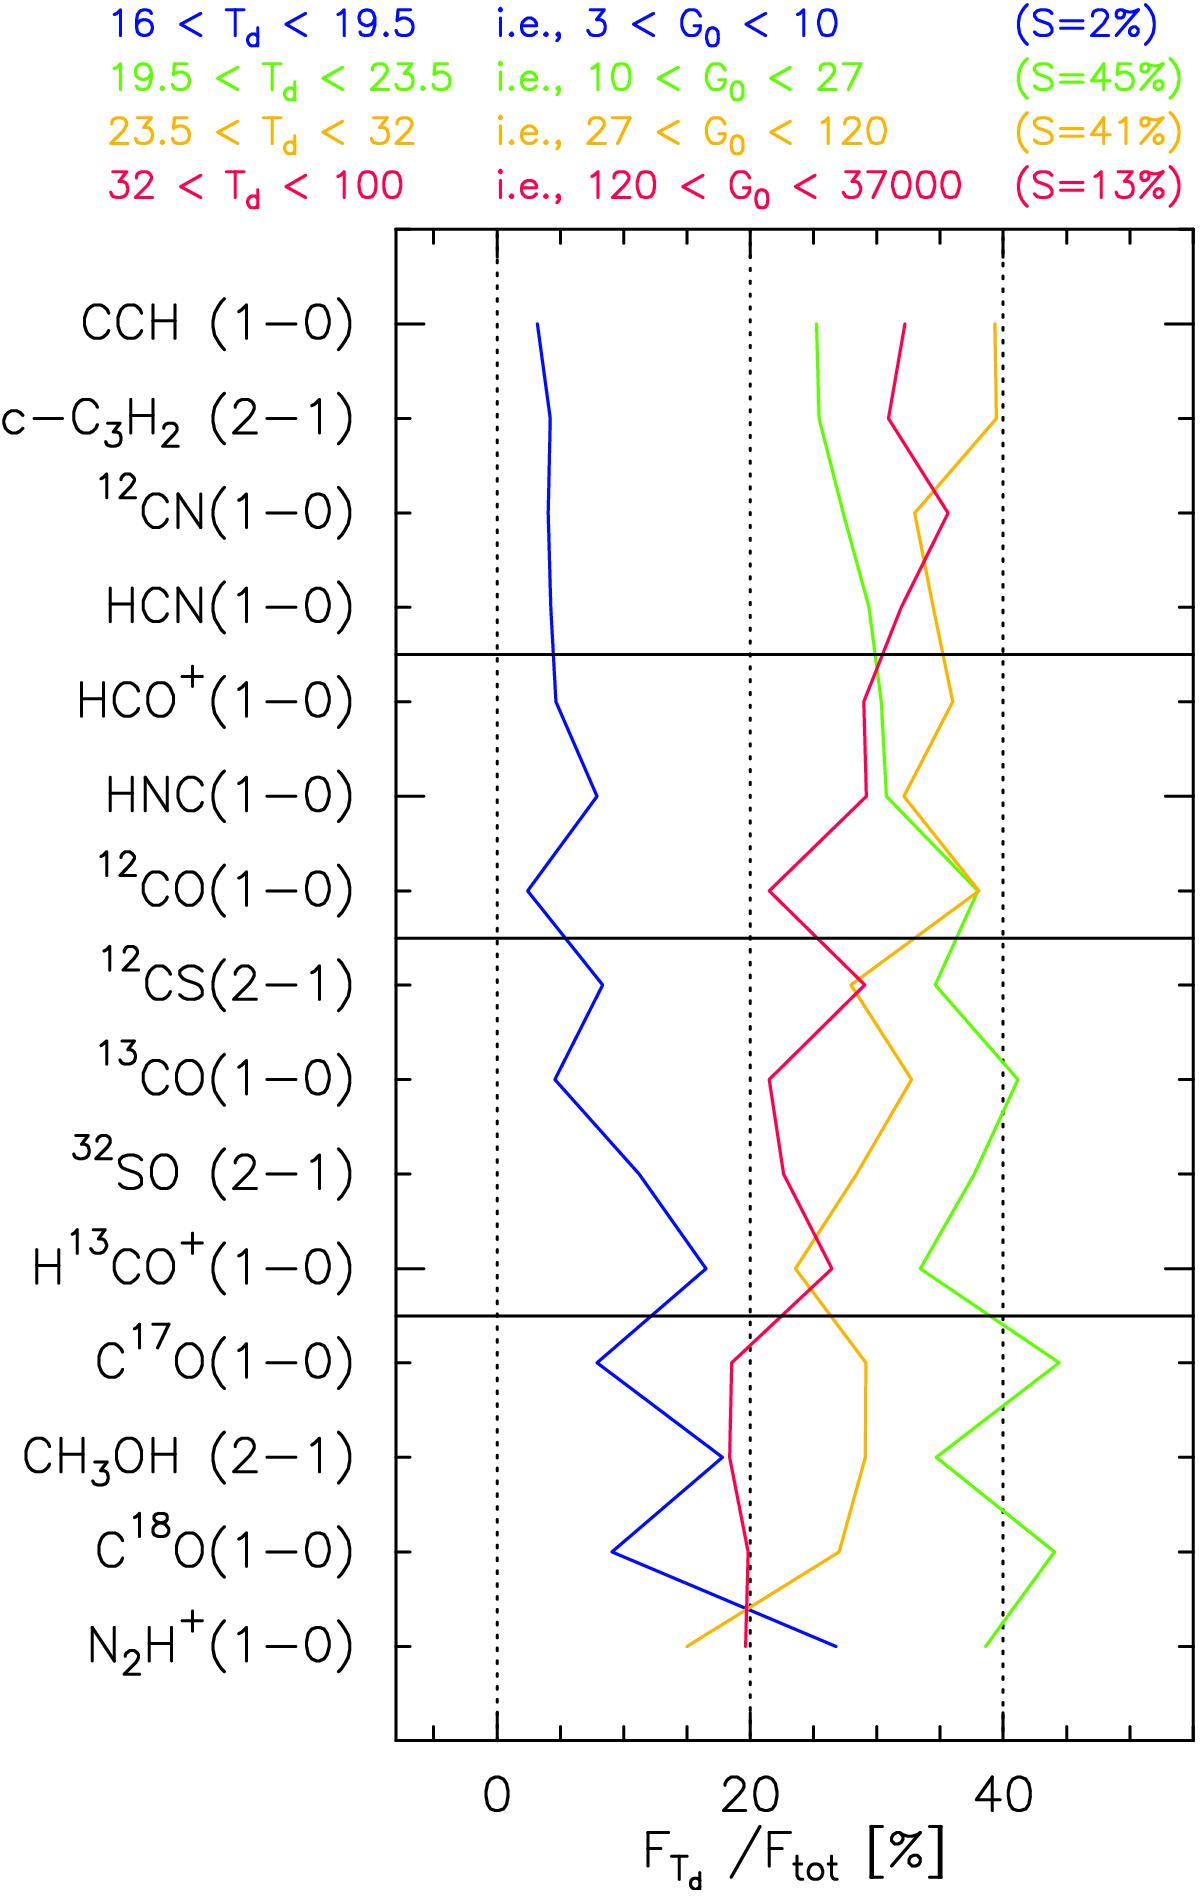
For each line, flux integrated over each of the four ![]() masks divided by the flux integrated over the observed field of view. All fluxes are computed between 9 and 12 km s-1. The black horizontal lines define the groups of lines described in Sect. 4.2.
masks divided by the flux integrated over the observed field of view. All fluxes are computed between 9 and 12 km s-1. The black horizontal lines define the groups of lines described in Sect. 4.2.
Current usage metrics show cumulative count of Article Views (full-text article views including HTML views, PDF and ePub downloads, according to the available data) and Abstracts Views on Vision4Press platform.
Data correspond to usage on the plateform after 2015. The current usage metrics is available 48-96 hours after online publication and is updated daily on week days.
Initial download of the metrics may take a while.