Fig. 6
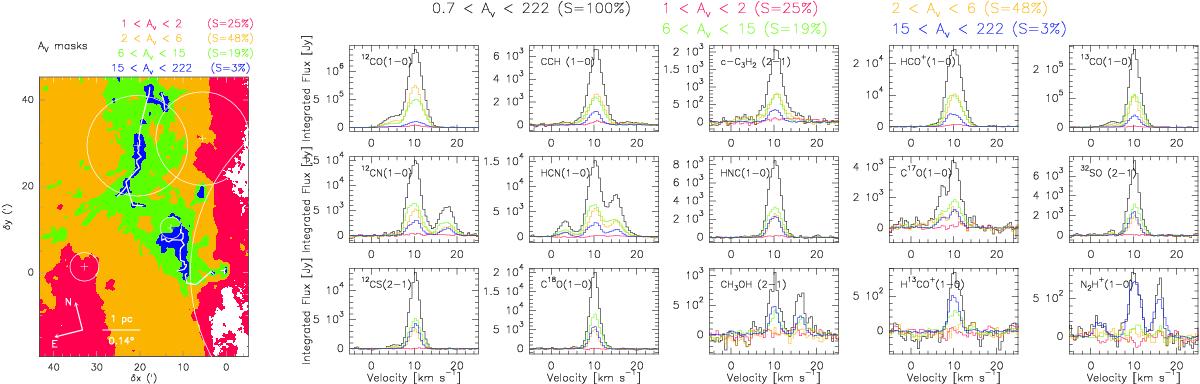
Left: spatial distribution of the four following masks: ![]() in red,
in red, ![]() in orange,
in orange, ![]() in green, and
in green, and ![]() in blue. The percentages in the legend list the fraction of the surface contained in the different masks. Right: flux is integrated over the masks as a function of velocity. The spectrum of different colors shows the evolution of the flux in each line as a function of the mask used: all pixels observed in black, all pixels with
in blue. The percentages in the legend list the fraction of the surface contained in the different masks. Right: flux is integrated over the masks as a function of velocity. The spectrum of different colors shows the evolution of the flux in each line as a function of the mask used: all pixels observed in black, all pixels with ![]() in red,
in red, ![]() in orange,
in orange, ![]() in green, and
in green, and ![]() in blue.
in blue.
Current usage metrics show cumulative count of Article Views (full-text article views including HTML views, PDF and ePub downloads, according to the available data) and Abstracts Views on Vision4Press platform.
Data correspond to usage on the plateform after 2015. The current usage metrics is available 48-96 hours after online publication and is updated daily on week days.
Initial download of the metrics may take a while.