Free Access
Fig. 9
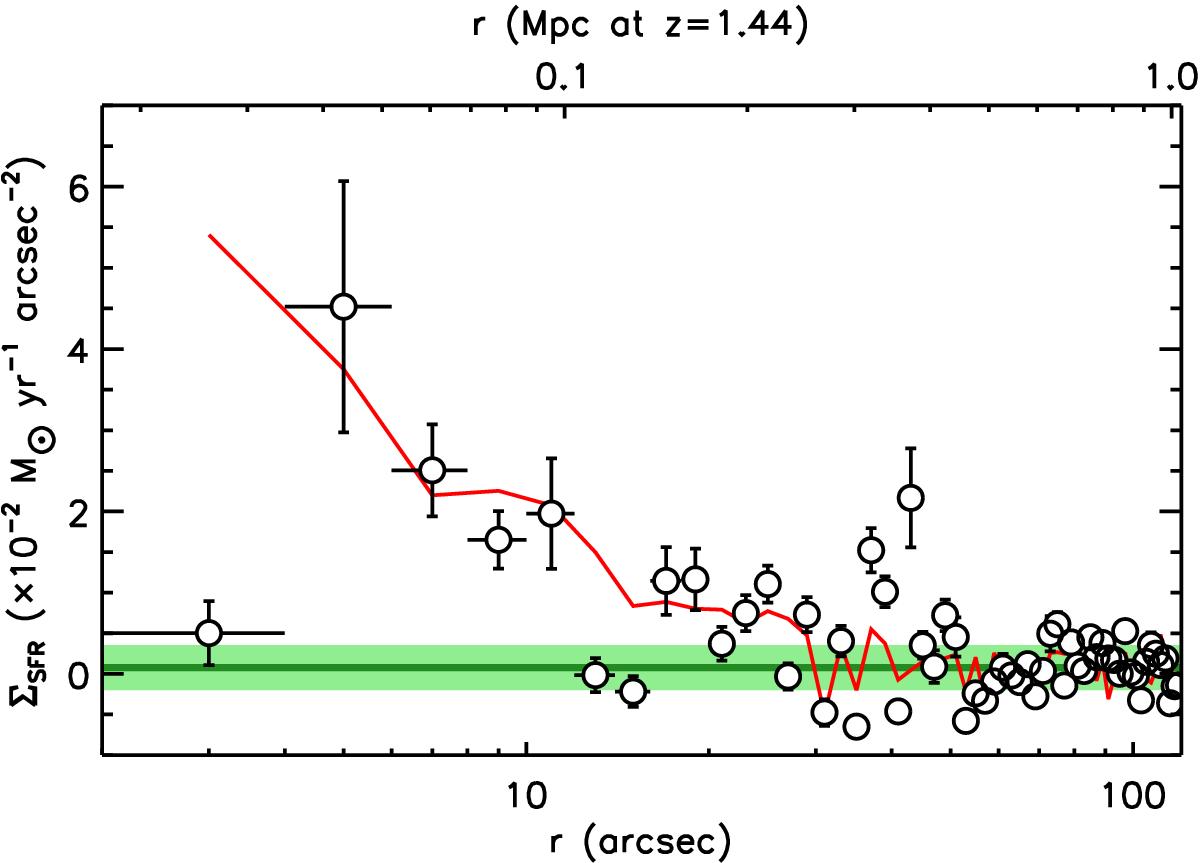
Distribution of the SFR density of satellite candidates for the low-z pBzK+UVJp sample, shown in bins of 2′′ (~17 kpc at z = 1.44). The background density, estimated at r > 50″, is shown in green while the red curve shows, for comparison, the total number density of satellite candidates, rescaled to match the SFR profile.
Current usage metrics show cumulative count of Article Views (full-text article views including HTML views, PDF and ePub downloads, according to the available data) and Abstracts Views on Vision4Press platform.
Data correspond to usage on the plateform after 2015. The current usage metrics is available 48-96 hours after online publication and is updated daily on week days.
Initial download of the metrics may take a while.