Fig. 8
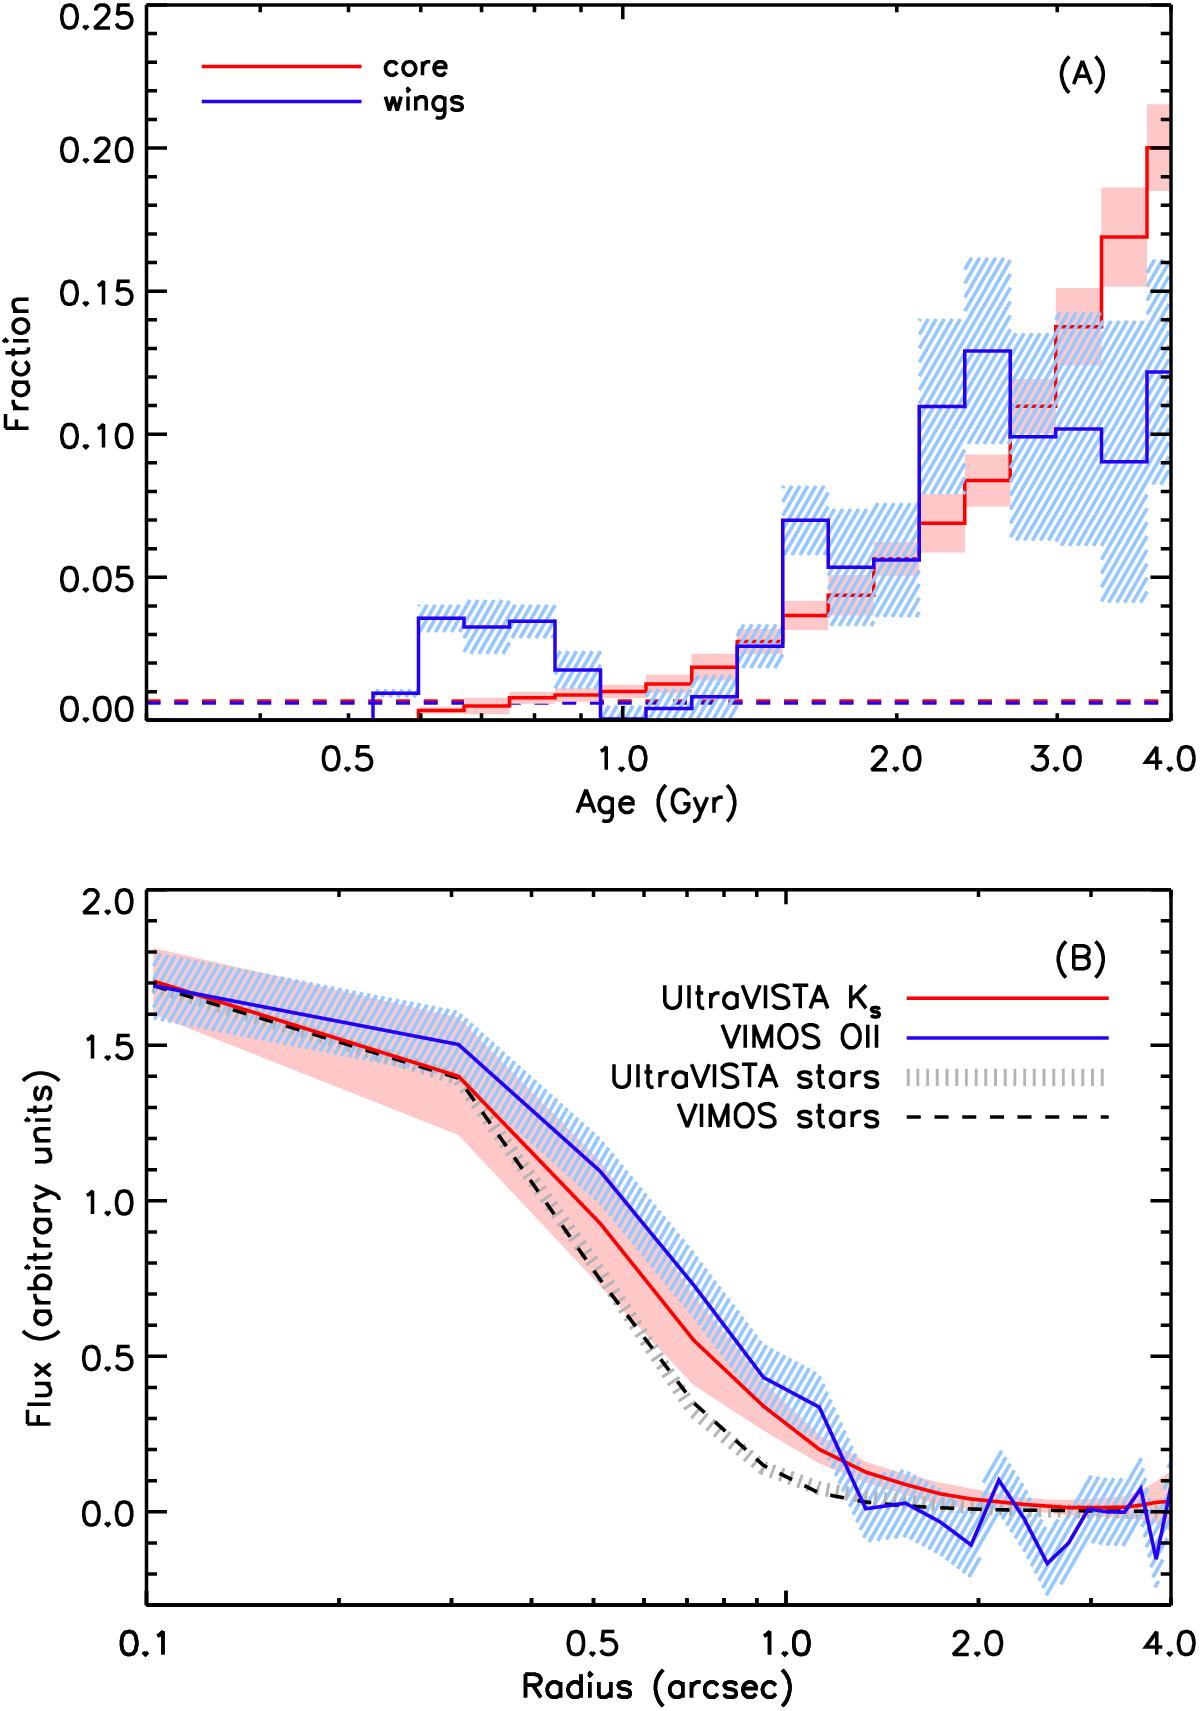
A): relative weight as a function of age of V10 SSP templates in the fit to the core and wings spectra (red and blue, respectively). The horizontal dashed lines show the level of the SFR derived in Sect. 4.1, if we assume that the red and blue histograms represent the SFH of the core and wings, respectively. B): radial profiles of the [OII]3727 Å line from the stacked VIMOS spectrum (blue) and Ks-band light (red) from UltraVISTA imaging, for the same galaxies. Both profiles are shown in 0.205′′ bins and have been normalized to the same flux. The dashed and dotted curves show the profile of stars in our VIMOS spectra and the Ks-band image, respectively.
Current usage metrics show cumulative count of Article Views (full-text article views including HTML views, PDF and ePub downloads, according to the available data) and Abstracts Views on Vision4Press platform.
Data correspond to usage on the plateform after 2015. The current usage metrics is available 48-96 hours after online publication and is updated daily on week days.
Initial download of the metrics may take a while.