Fig. 6
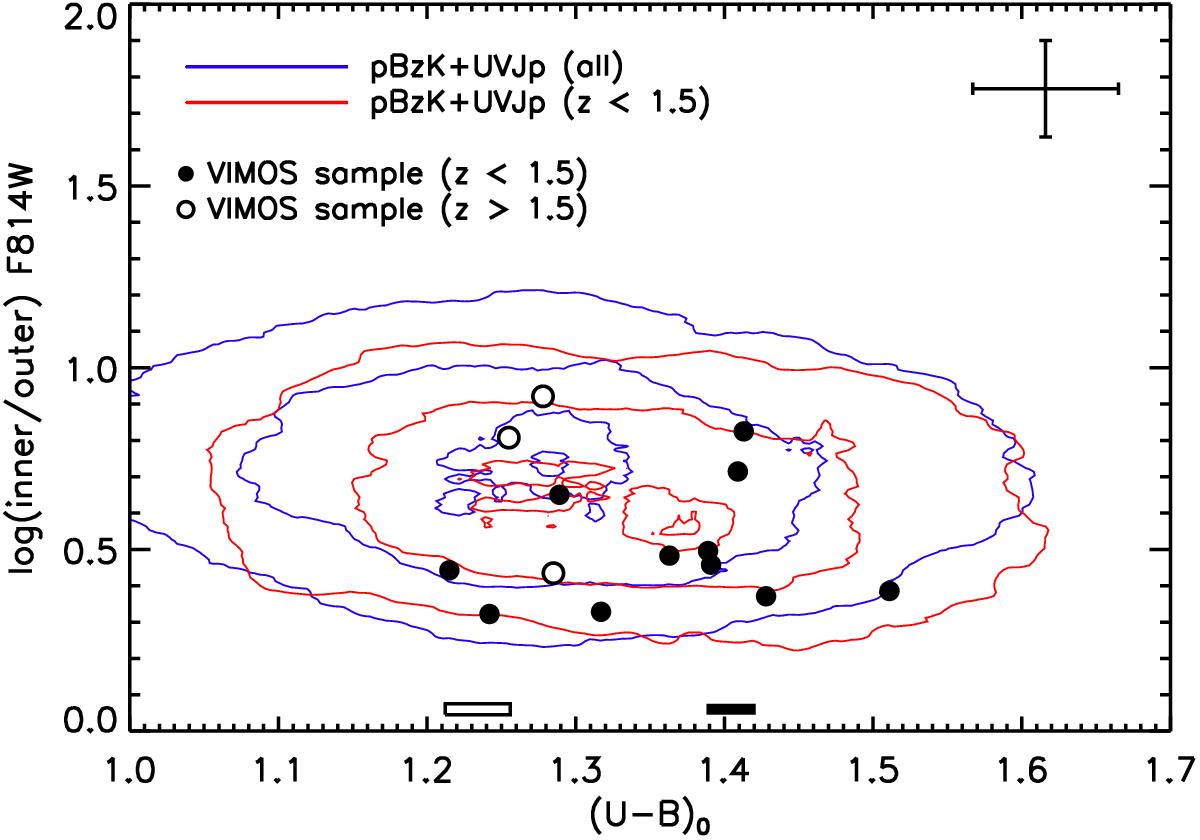
Ratio of rest-frame UV flux in the inner and outer aperture, based on the HST/ACS F814W mosaic, as a function of rest-frame U−B color. Filled and empty circles show pBzKs below and above z = 1.5, respectively, using the same relative scale. The blue and red contours mark the distribution of BzK + UVJ-selected galaxies (see Sect. 4.2) in the full z = 1.5−2.5 range and at z < 1.5, respectively. The error bars in the upper right corner show the typical uncertainty on both quantities while the filled and empty bars show the rest-frame color distribution of low-S/N pBzKs at z < 1.5 and z> 1.5, respectively.
Current usage metrics show cumulative count of Article Views (full-text article views including HTML views, PDF and ePub downloads, according to the available data) and Abstracts Views on Vision4Press platform.
Data correspond to usage on the plateform after 2015. The current usage metrics is available 48-96 hours after online publication and is updated daily on week days.
Initial download of the metrics may take a while.