Fig. 5
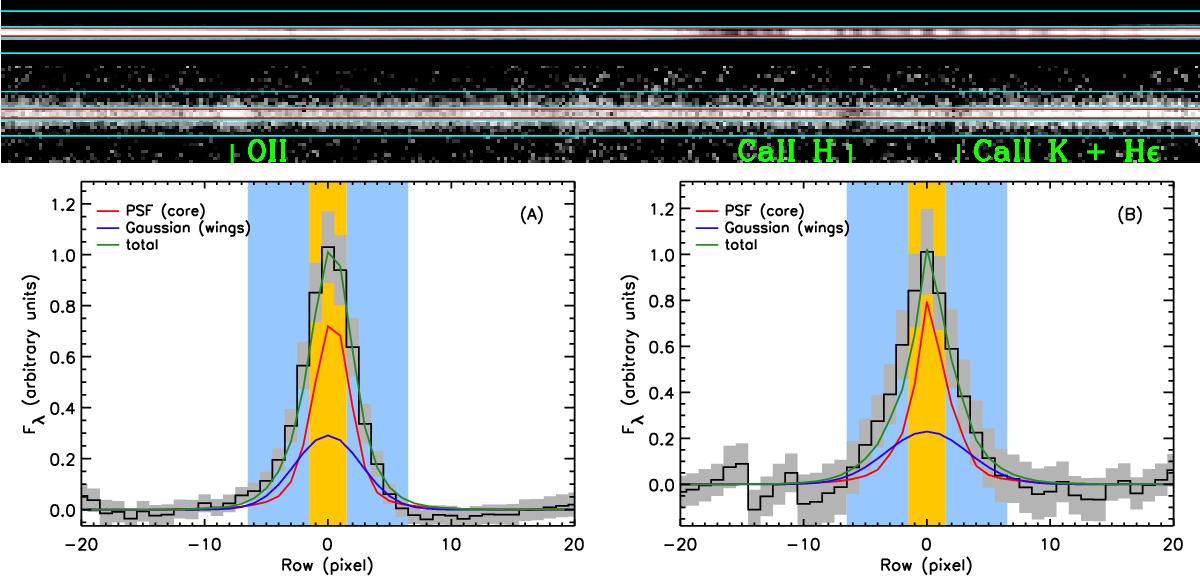
Top: median 2D spectra of stars (top row) and pBzKs in the range z = 1.2−1.5 (bottom row), in the same wavelength range and using the same relative flux scale. Prominent features in the stacked galaxy spectrum are indicated in green. The red and cyan lines show the inner and outer extraction apertures, respectively. Bottom: cross-dispersion profile of the stacked pBzK spectrum at 3650−4050 Å rest-frame (dark histogram with gray errors), fit with a combination of a point-source (red) and a Gaussian (blue) profile. The inner and outer extraction apertures are indicated by the orange and light blue shaded regions, respectively. Panels A) and B) show, respectively, the cross-dispersion profiles before and after correcting for galaxy morphology. Only the profile shown in panel A) was used for the decomposition and analysis described in Sect. 3.1 and below.

Current usage metrics show cumulative count of Article Views (full-text article views including HTML views, PDF and ePub downloads, according to the available data) and Abstracts Views on Vision4Press platform.
Data correspond to usage on the plateform after 2015. The current usage metrics is available 48-96 hours after online publication and is updated daily on week days.
Initial download of the metrics may take a while.