Free Access
Fig. 4
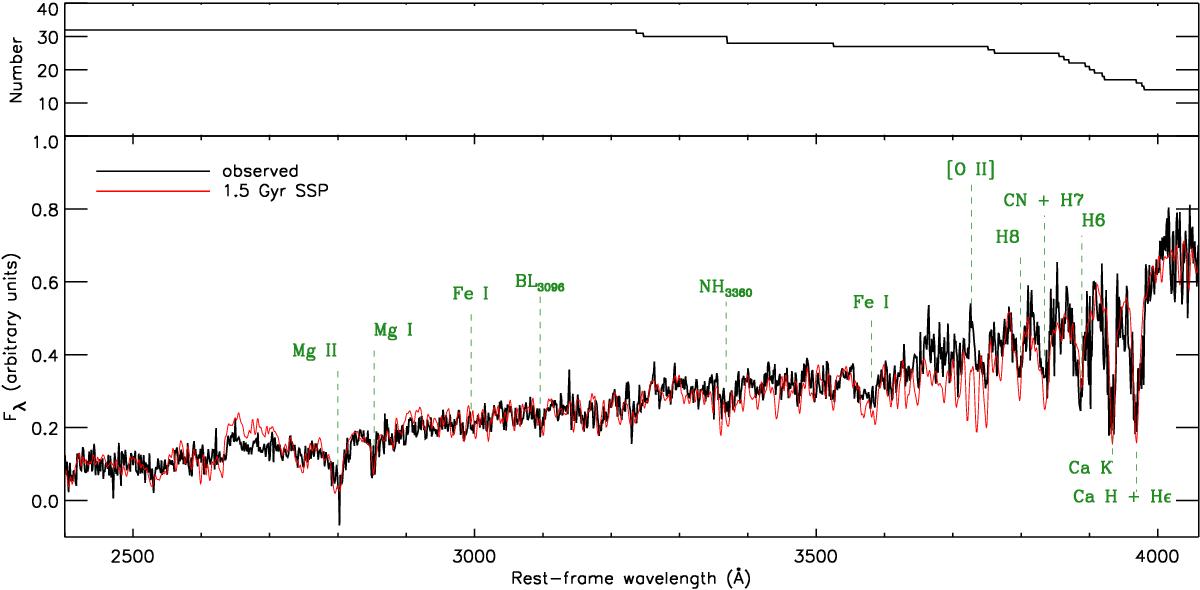
Top: number of A and B quality spectra contributing to the median spectrum as a function of rest-frame wavelength. Bottom: stack of all A and B quality spectra, as a function of rest-frame wavelength, with a 1.5 Gyr SSP template (Maraston & Strömbäck 2011) for comparison. Prominent spectral features are indicated in green.
Current usage metrics show cumulative count of Article Views (full-text article views including HTML views, PDF and ePub downloads, according to the available data) and Abstracts Views on Vision4Press platform.
Data correspond to usage on the plateform after 2015. The current usage metrics is available 48-96 hours after online publication and is updated daily on week days.
Initial download of the metrics may take a while.