Fig. 2
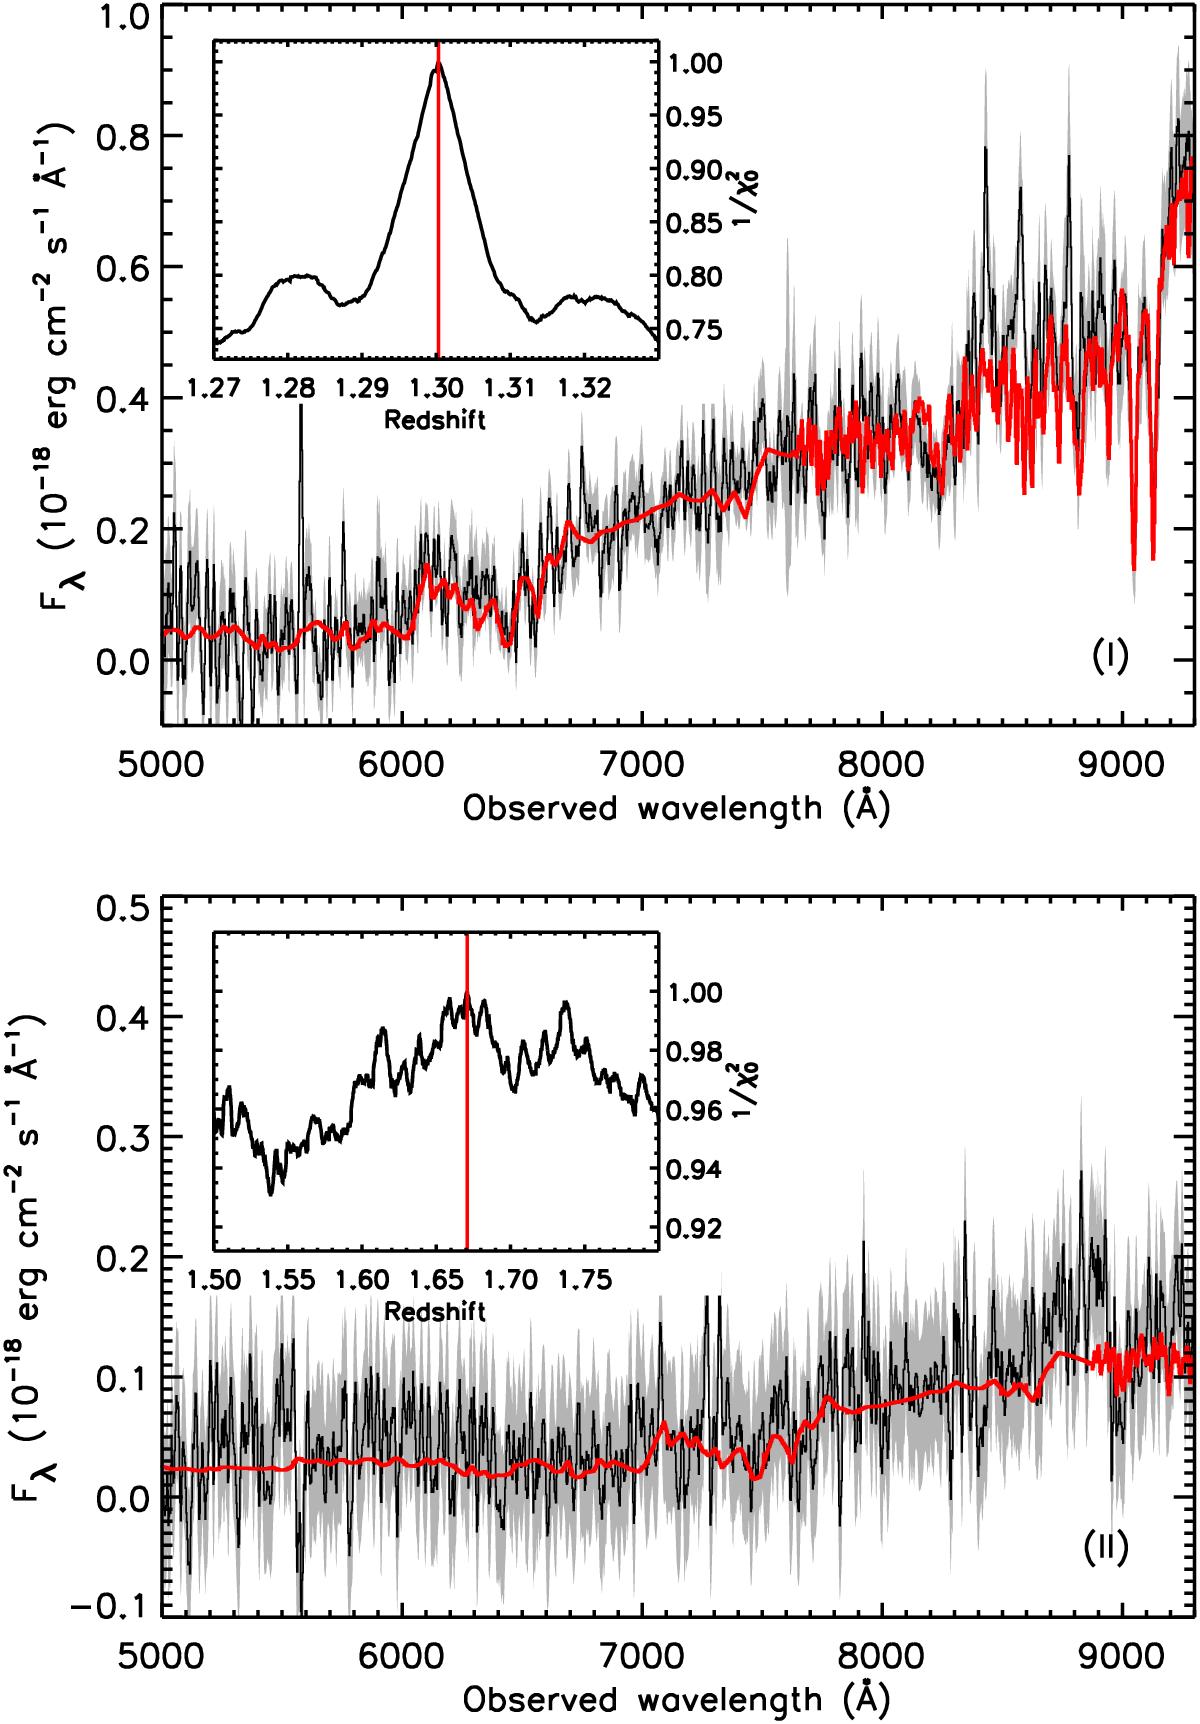
Examples of a secure (top; “A” quality; ID 225039) and an uncertain (bottom; “C” quality; ID 240680) redshift. In each case, the black curve shows the observed spectrum, with error in gray, and the red one the best-fit model. The inset shows the inverse of the reduced χ2, with the best-fit solution marked by a red vertical line. Each spectrum has been rebinned to a width of 5 pixels.
Current usage metrics show cumulative count of Article Views (full-text article views including HTML views, PDF and ePub downloads, according to the available data) and Abstracts Views on Vision4Press platform.
Data correspond to usage on the plateform after 2015. The current usage metrics is available 48-96 hours after online publication and is updated daily on week days.
Initial download of the metrics may take a while.