Free Access
Fig. 1
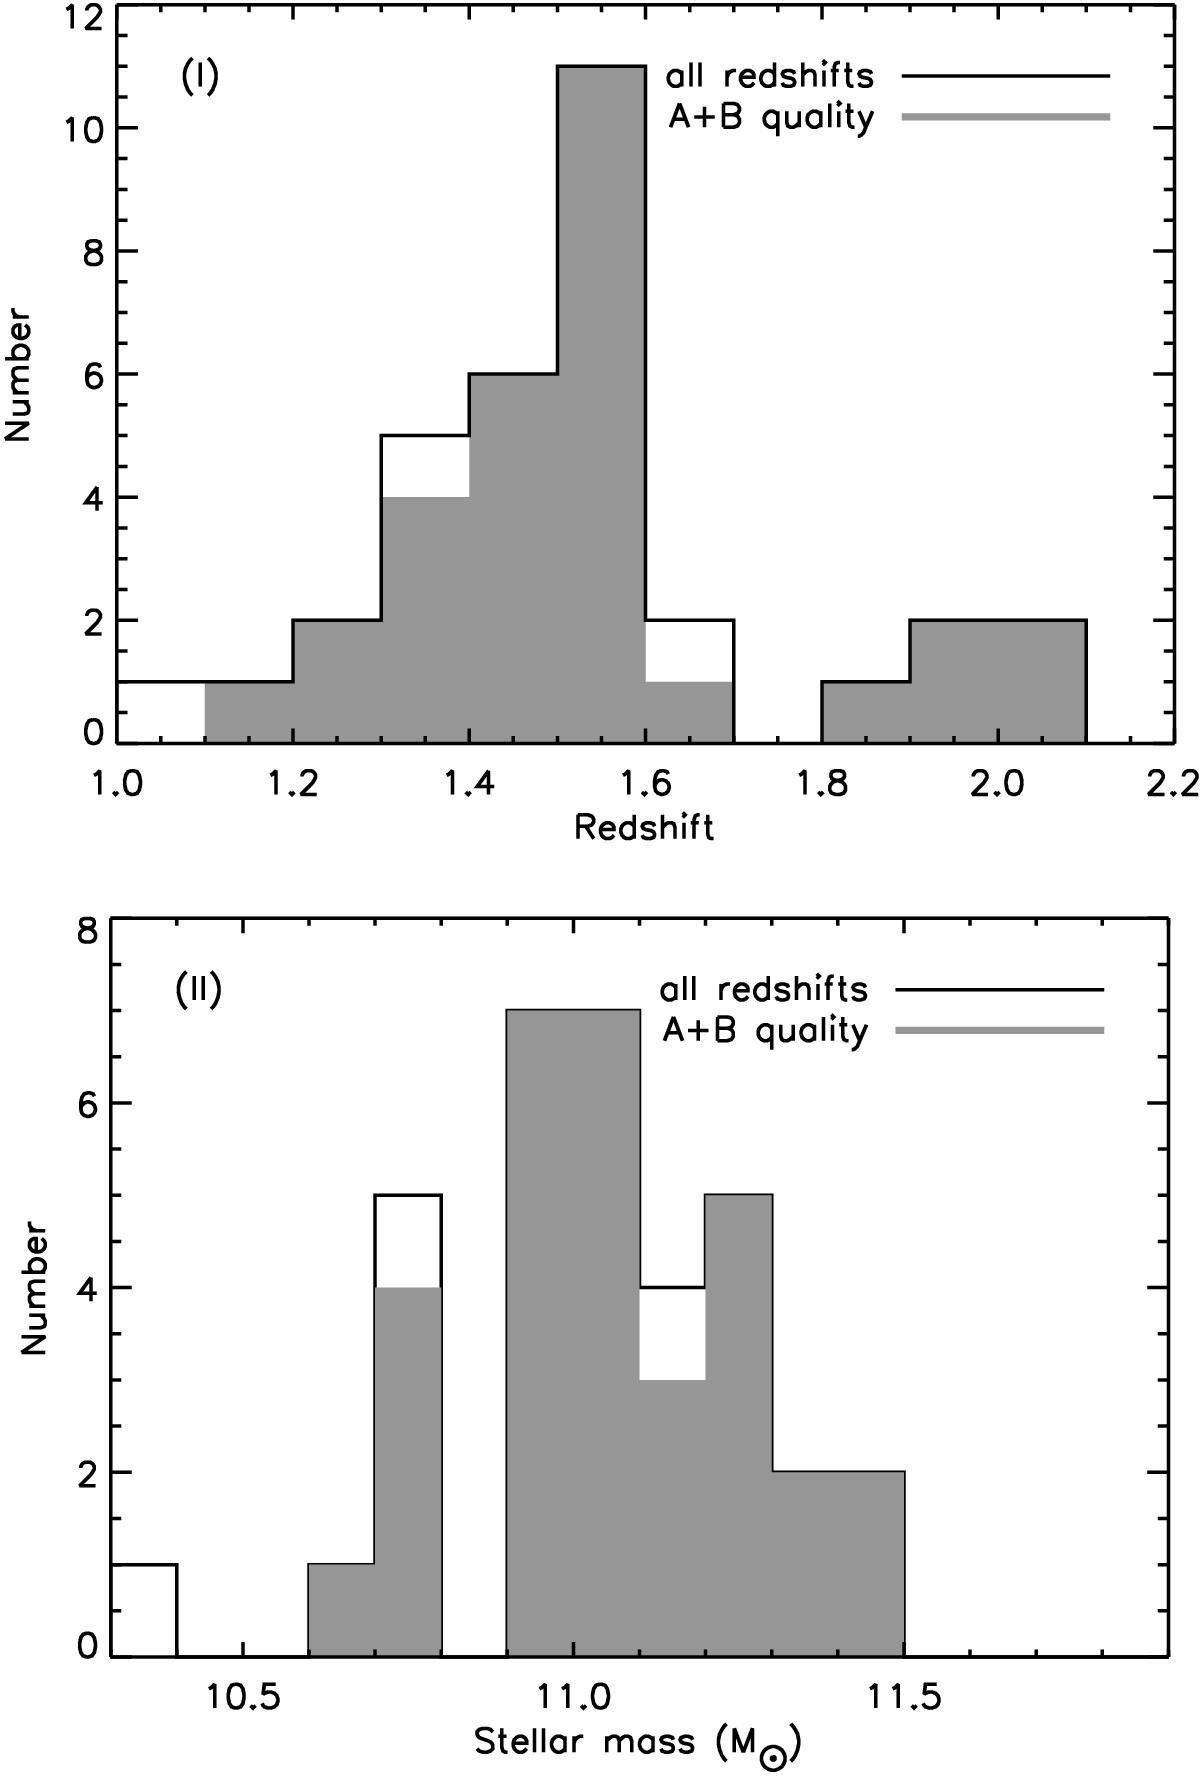
Top: distribution of spectroscopic redshifts (solid histogram) derived from fitting the observed spectra with stellar population models, with the shaded histogram showing the secure ones. Bottom: distribution of stellar masses (Salpeter IMF) derived from UltraVISTA photometry, using the same grid of models.
This figure is made of several images, please see below:
Current usage metrics show cumulative count of Article Views (full-text article views including HTML views, PDF and ePub downloads, according to the available data) and Abstracts Views on Vision4Press platform.
Data correspond to usage on the plateform after 2015. The current usage metrics is available 48-96 hours after online publication and is updated daily on week days.
Initial download of the metrics may take a while.