Fig. 9
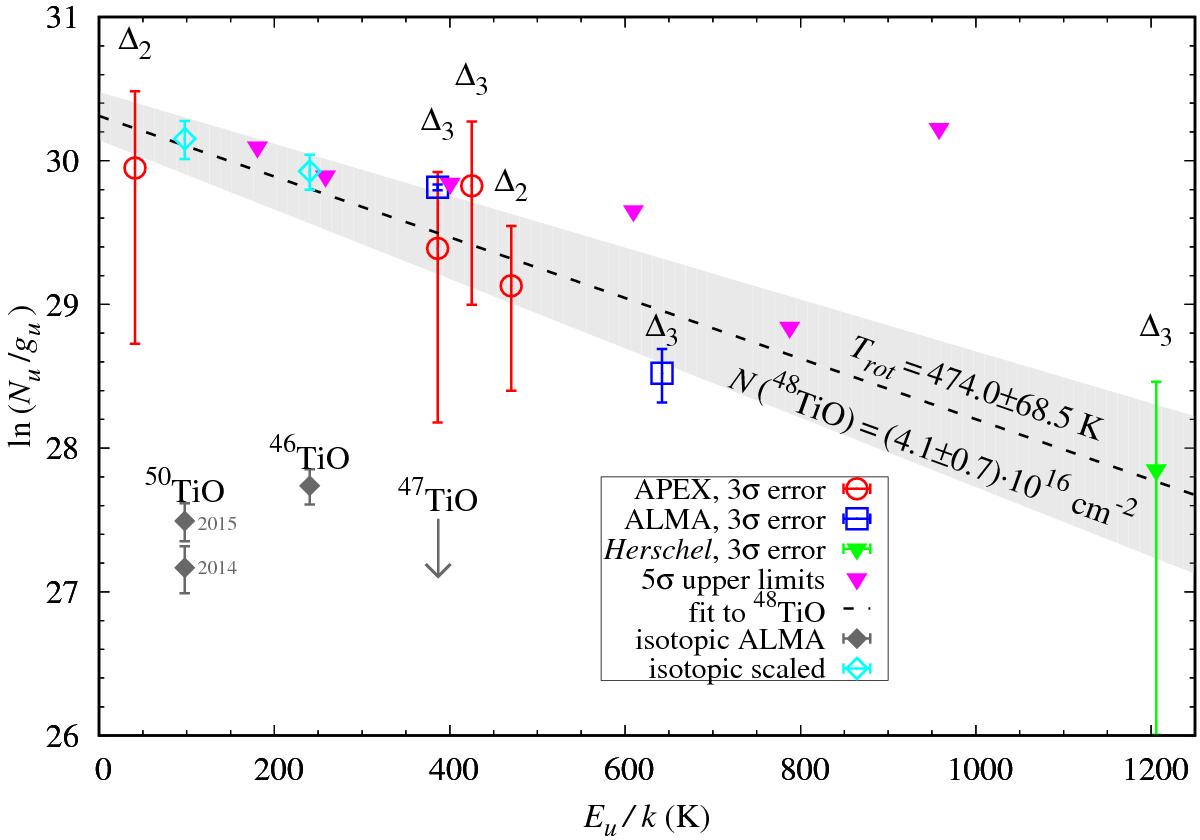
Rotational diagram for TiO. Red, blue, and green points represent detected lines and the magenta triangles indicate 5σ upper limits. The linear fit that constrains the excitation temperature and column density of the main isotopologue, 48TiO is shown with the dashed line and the shaded area corresponds to 1σ uncertainty of the fit. Gray points and an arrow (lower left) correspond to measurements of 46TiO and 50TiO and to an upper limit for 47TiO. The two 2015 measurements for 46TiO and 50TiO, scaled by reciprocal of their solar abundances, are shown with cyan diamonds. They were included in the final fit.
Current usage metrics show cumulative count of Article Views (full-text article views including HTML views, PDF and ePub downloads, according to the available data) and Abstracts Views on Vision4Press platform.
Data correspond to usage on the plateform after 2015. The current usage metrics is available 48-96 hours after online publication and is updated daily on week days.
Initial download of the metrics may take a while.