Fig. 7
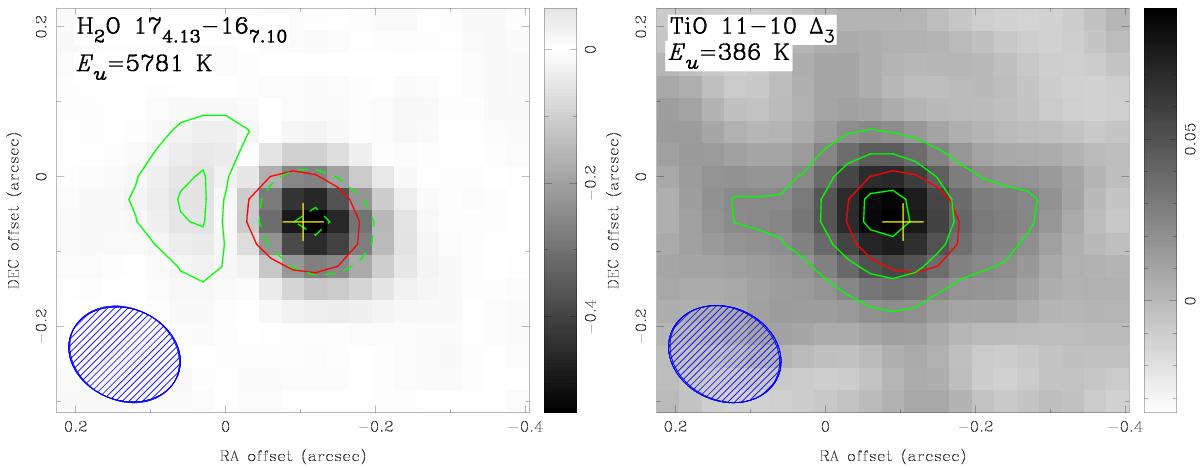
Maps of the infall signatures. The maps were produced by integrating the flux density within 55–64 km s-1 for H2O 174,13 → 167,10 and within 57–67 km s-1 for TiO J = 11 → 10Δ3 (cf. Fig. 5). The water line at this range is dominated by absorption (negative flux), which is shown with green dashed contours, and residual emission outside the stellar disk (positive flux), which is shown with solid contours. The infall in the TiO line is seen mainly in emission (solid contours). The symbols have the same meaning as in Fig. 6.
Current usage metrics show cumulative count of Article Views (full-text article views including HTML views, PDF and ePub downloads, according to the available data) and Abstracts Views on Vision4Press platform.
Data correspond to usage on the plateform after 2015. The current usage metrics is available 48-96 hours after online publication and is updated daily on week days.
Initial download of the metrics may take a while.