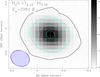
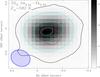
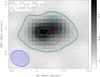
Fig. 6
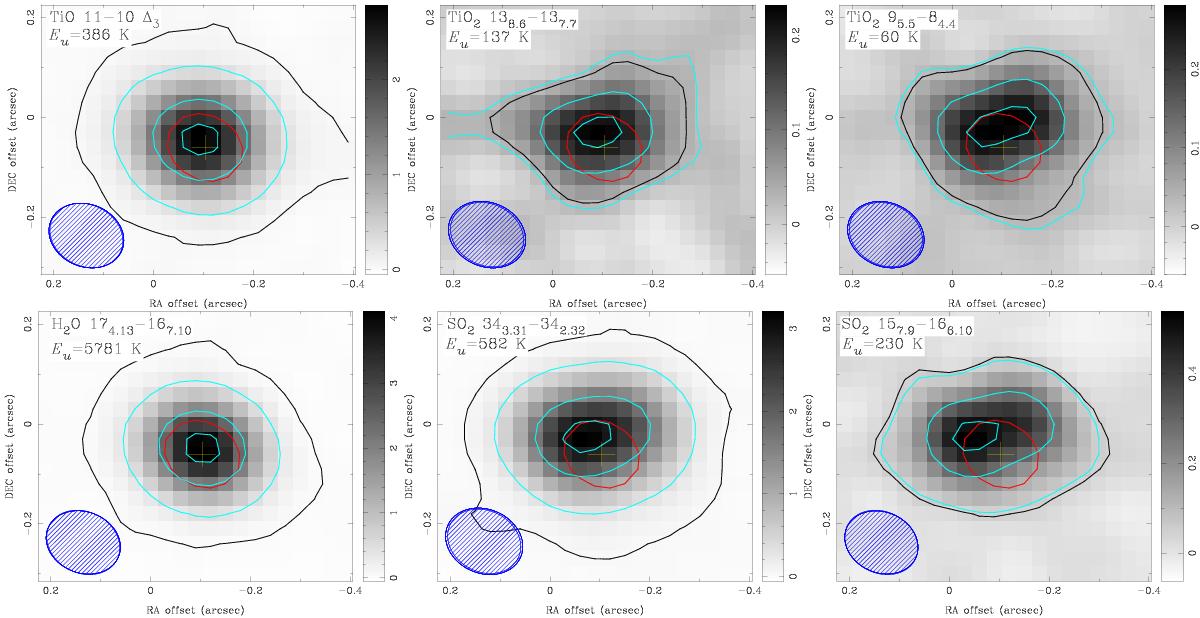
Maps of molecular emission in the extended atmosphere of Mira. The emission was integrated in the spectral range corresponding to the main emission component between about 35 and 55 km s-1 (optimized for each transition). The emission is shown in gray in units of Jy km s-1 and with cyan contours at 10, 50, and 90% of the maximum flux. Additionally, a black contour at the 3σ noise level is shown. The location of continuum center of Mira A is indicated with a plus symbol whose size corresponds to the physical size of the stellar disk. The red contour shows the continuum emission at 50% of the peak value and represents the continuum extent smeared by the synthesized beam. The FWHMs of the beams are shown with hatched ellipses.
Current usage metrics show cumulative count of Article Views (full-text article views including HTML views, PDF and ePub downloads, according to the available data) and Abstracts Views on Vision4Press platform.
Data correspond to usage on the plateform after 2015. The current usage metrics is available 48-96 hours after online publication and is updated daily on week days.
Initial download of the metrics may take a while.