Free Access
Fig. 4
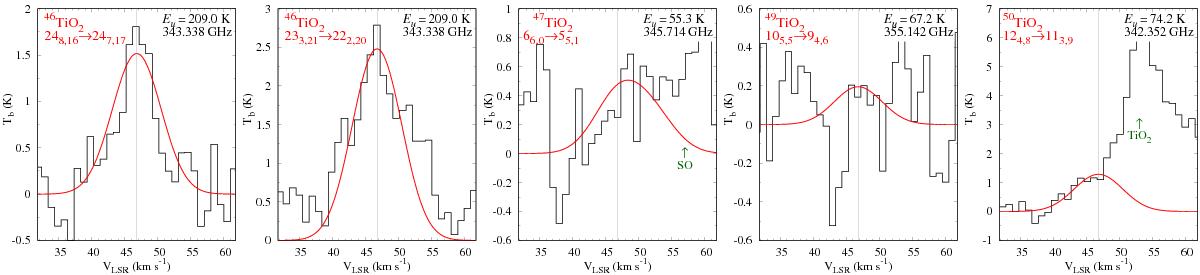
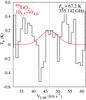
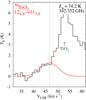
Sample spectra of the rare isotopologues of TiO2. Black histograms show observations and the red lines show CASSIS simulations corresponding to upper limits on the column densities of the rare isotopologues. Only features of 46TiO2 are considered detections.
This figure is made of several images, please see below:
Current usage metrics show cumulative count of Article Views (full-text article views including HTML views, PDF and ePub downloads, according to the available data) and Abstracts Views on Vision4Press platform.
Data correspond to usage on the plateform after 2015. The current usage metrics is available 48-96 hours after online publication and is updated daily on week days.
Initial download of the metrics may take a while.