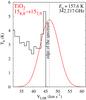
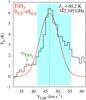
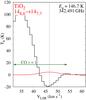
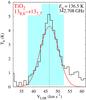
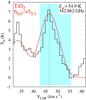
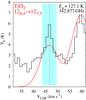
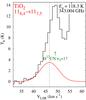
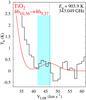
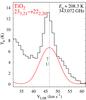
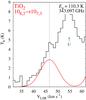
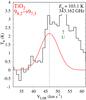
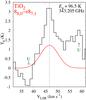
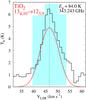
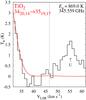
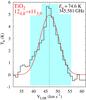
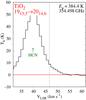
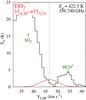
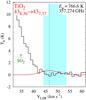
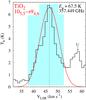
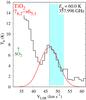
Fig. 3
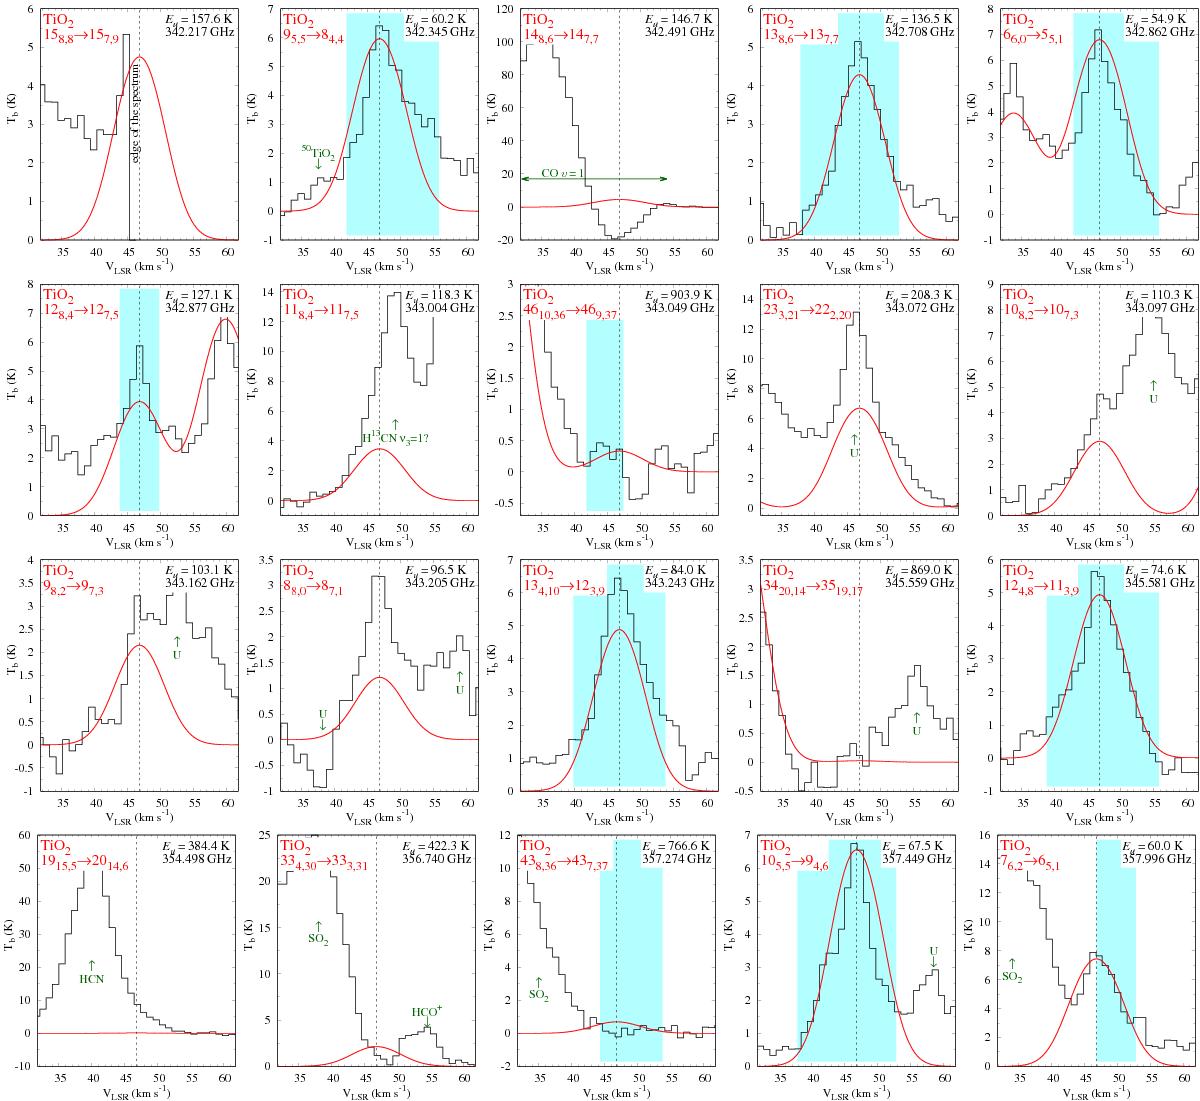
All TiO2 transitions covered by the ALMA 2015 data. The black histograms present the observations and the red line shows a simulation based on the best-fit excitation model of TiO2 found with CASSIS. Each panel is centered on the transition labeled in the upper left corner and the central velocity is indicated with a vertical dashed line. When another line of TiO2 is covered by the plot, its simulation is also shown. The highlighted parts of the TiO2 profiles were used in our minimization routine. Many of the lines shown are contaminated by emission of other species, the strongest of which are labeled in green. Lines with Eu higher than about 300 K were not detected and their spectra are shown for completeness.
Current usage metrics show cumulative count of Article Views (full-text article views including HTML views, PDF and ePub downloads, according to the available data) and Abstracts Views on Vision4Press platform.
Data correspond to usage on the plateform after 2015. The current usage metrics is available 48-96 hours after online publication and is updated daily on week days.
Initial download of the metrics may take a while.