Fig. 2
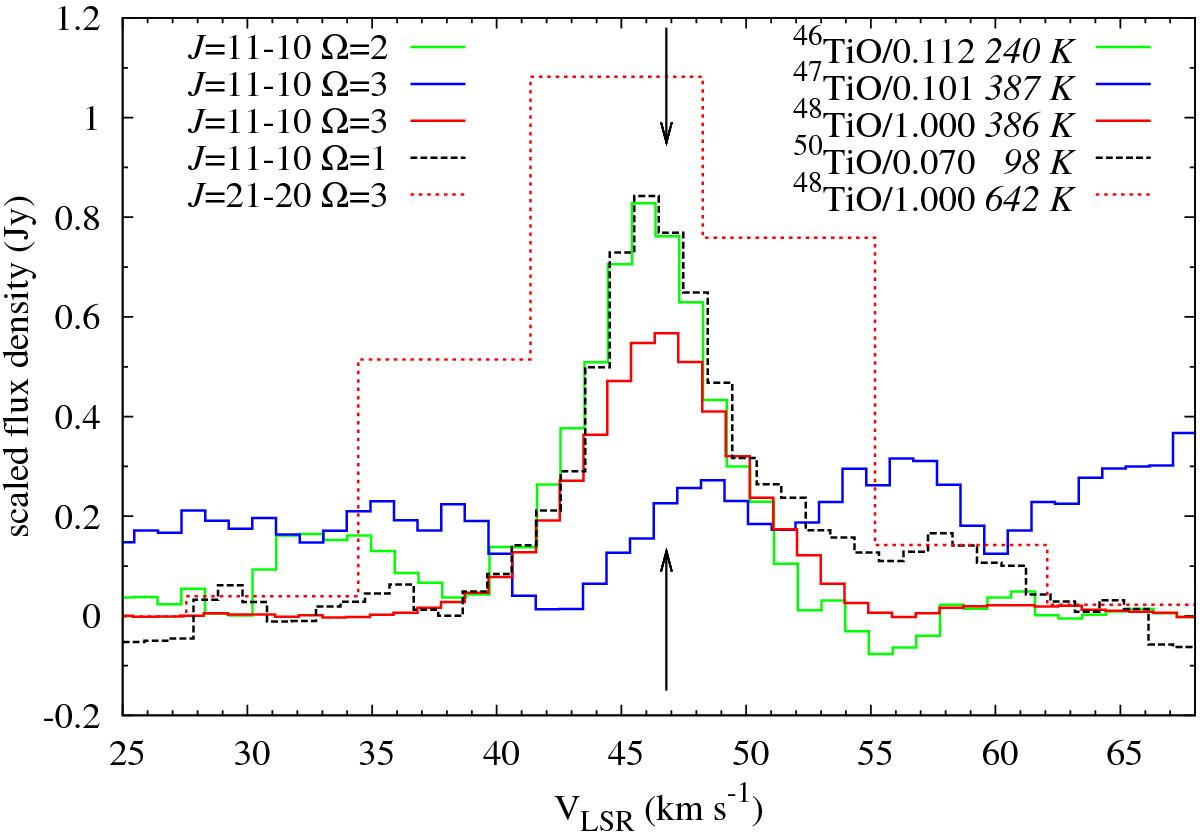
Line profiles of TiO isotopologues observed with ALMA (cf. Table 2). One line of 50TiO observed in June 2014 is not shown because is covered by one resolution element only. The flux densities were scaled by their relative solar isotopic ratios, as indicated in the right legend. The arrows indicate the center-of-mass velocity of Mira. Spectra were extracted from regions encompassing the entire emission region.
Current usage metrics show cumulative count of Article Views (full-text article views including HTML views, PDF and ePub downloads, according to the available data) and Abstracts Views on Vision4Press platform.
Data correspond to usage on the plateform after 2015. The current usage metrics is available 48-96 hours after online publication and is updated daily on week days.
Initial download of the metrics may take a while.