Fig. C.1
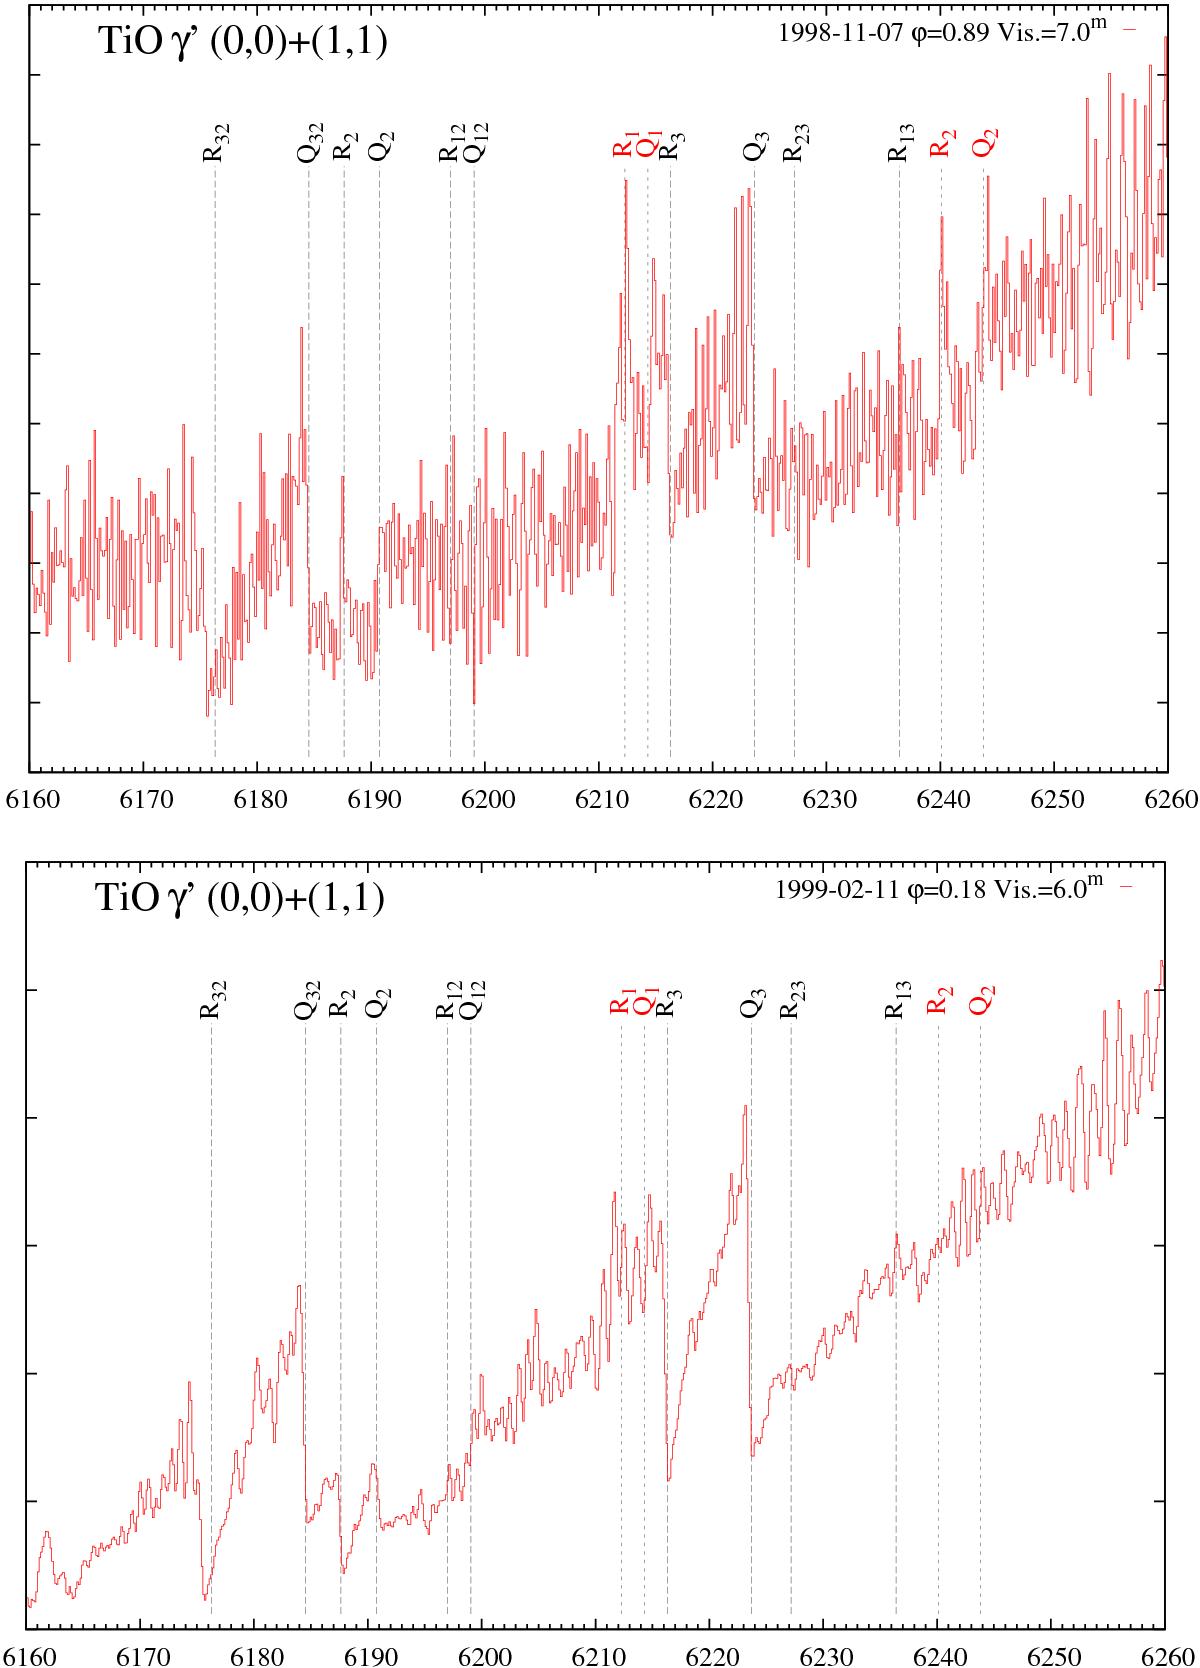
Spectra of Mira covering the part of the γ′ system of TiO that occasionally displays emission features. The date and corresponding visual phase and magnitude are indicated in the top right corner of each panel. The spectra are shown in the chronological order. Branches forming main electronic features are indicated in black and red for the (0,0) and (1,1) bands, respectively. The wavelength scale in Å is in the heliocentric rest frame.
Current usage metrics show cumulative count of Article Views (full-text article views including HTML views, PDF and ePub downloads, according to the available data) and Abstracts Views on Vision4Press platform.
Data correspond to usage on the plateform after 2015. The current usage metrics is available 48-96 hours after online publication and is updated daily on week days.
Initial download of the metrics may take a while.