Fig. 10
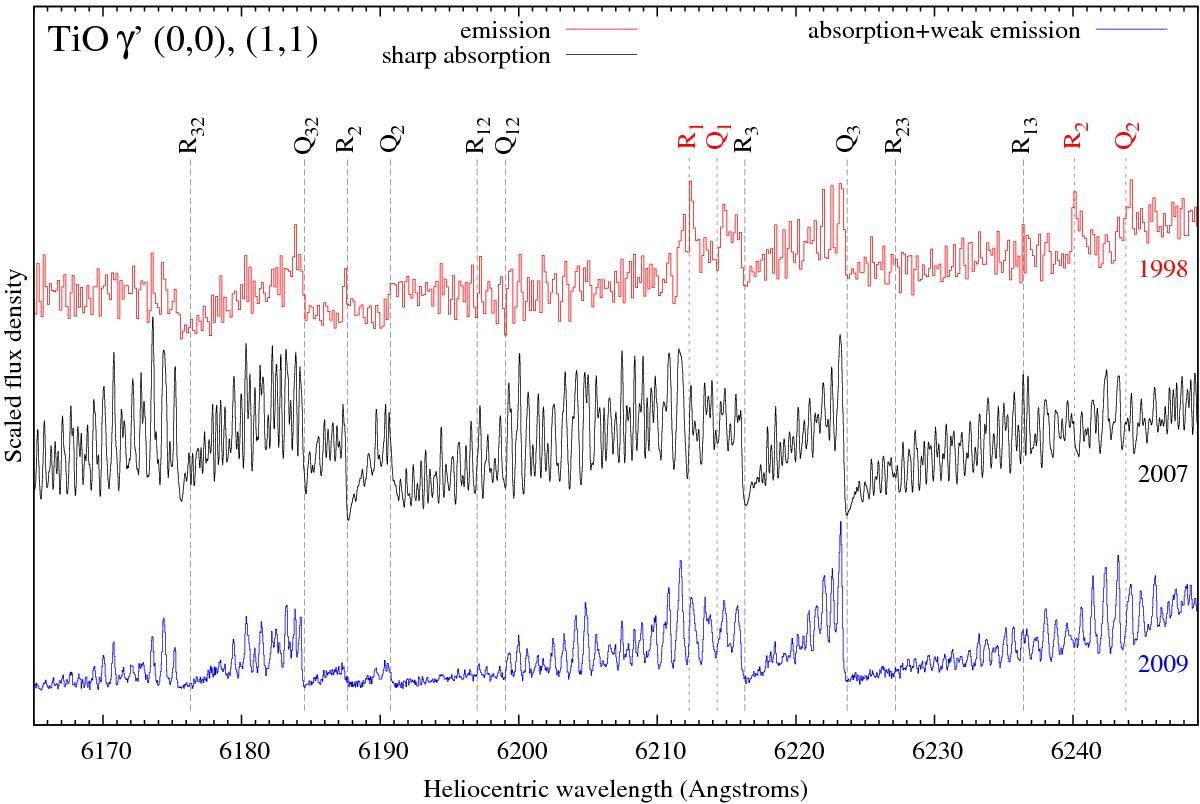
Sample spectra of the TiO γ′ (0,0) and (1,1) bands illustrating the emission-dominated bands (top, red; 7 Nov. 1998), sharp absorption band-heads (middle, black; 20 Jan. 2007), and absorption bands partially filled with emission (bottom, blue; 8 Aug. 2009). The full collection of spectra is shown in Fig. C.1. Main TiO features are identified with vertical dashed lines, with black and red labels corresponding to the (0,0) and (1,1) bands, respectively.
Current usage metrics show cumulative count of Article Views (full-text article views including HTML views, PDF and ePub downloads, according to the available data) and Abstracts Views on Vision4Press platform.
Data correspond to usage on the plateform after 2015. The current usage metrics is available 48-96 hours after online publication and is updated daily on week days.
Initial download of the metrics may take a while.