Fig. 1
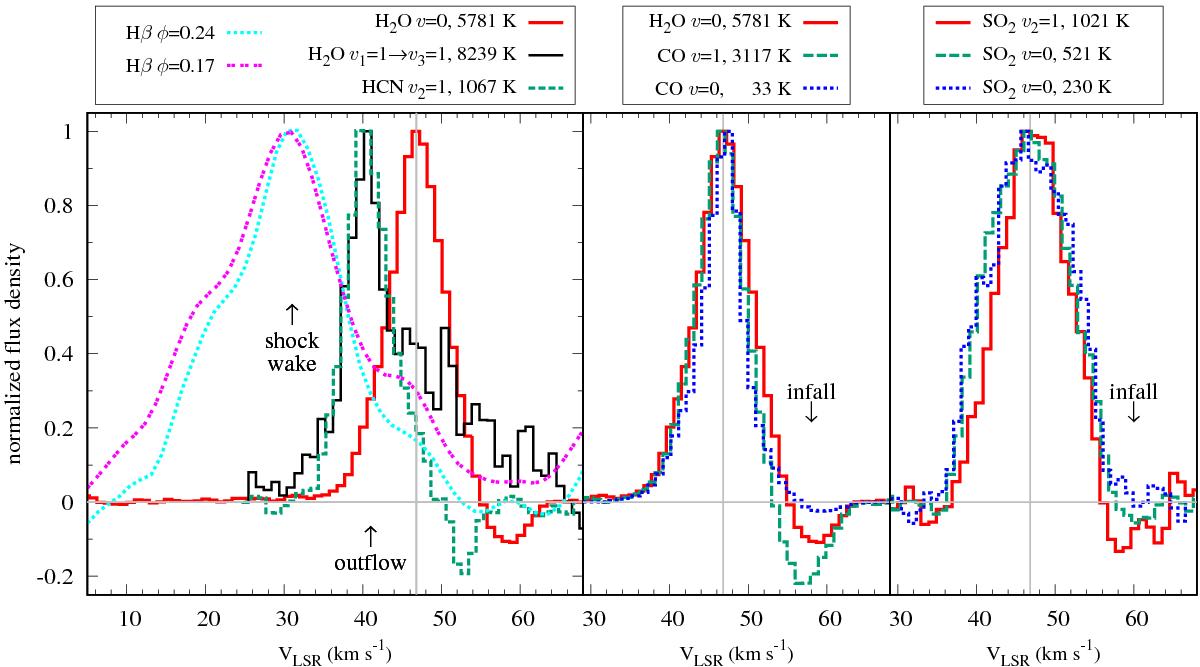
Sample spectral profiles of transitions probing the atmosphere of Mira. The value of Eu is indicated for each transition in the legend. The transitions were chosen to show features requiring a broad range of excitation temperatures. The center-of-mass velocity of Mira is shown with the vertical line. The panels cover different velocity ranges but are in scale. All molecular spectra were extracted within an aperture of about 0.̋2 radius, which almost fully encompasses the emission of TiO and TiO2. Left: high-excitation lines, H2O ν= 0 174,13 → 167,10, H2O ν1 = 1 → ν3 = 1123,9 → 115,6, and HCN ν2 = 1J = 4 → 3. The two latter lines are seen at a peculiar radial velocity of ~40 km s-1 and probe a region of the atmosphere that is affected by a shock. Also shown in this panel are two profiles of the Hβ hydrogen recombination lines observed in 2010 at phases 0.17 and 0.24 bracketing the phase of the ALMA data, ϕ = 0.21. The hydrogen lines probe the recombining wake of the strong shock. Their profiles are slightly affected by absorption in photospheric lines of TiO and their broad profile is a result of scattering. Center: transition from levels in a broad range of Eu that show an absorption feature indicative of an infall. Right: lines of SO2 of moderate and high excitation. The SO2 profiles are wider (more parabolic) than any other molecular features observed.
Current usage metrics show cumulative count of Article Views (full-text article views including HTML views, PDF and ePub downloads, according to the available data) and Abstracts Views on Vision4Press platform.
Data correspond to usage on the plateform after 2015. The current usage metrics is available 48-96 hours after online publication and is updated daily on week days.
Initial download of the metrics may take a while.