Fig. 6
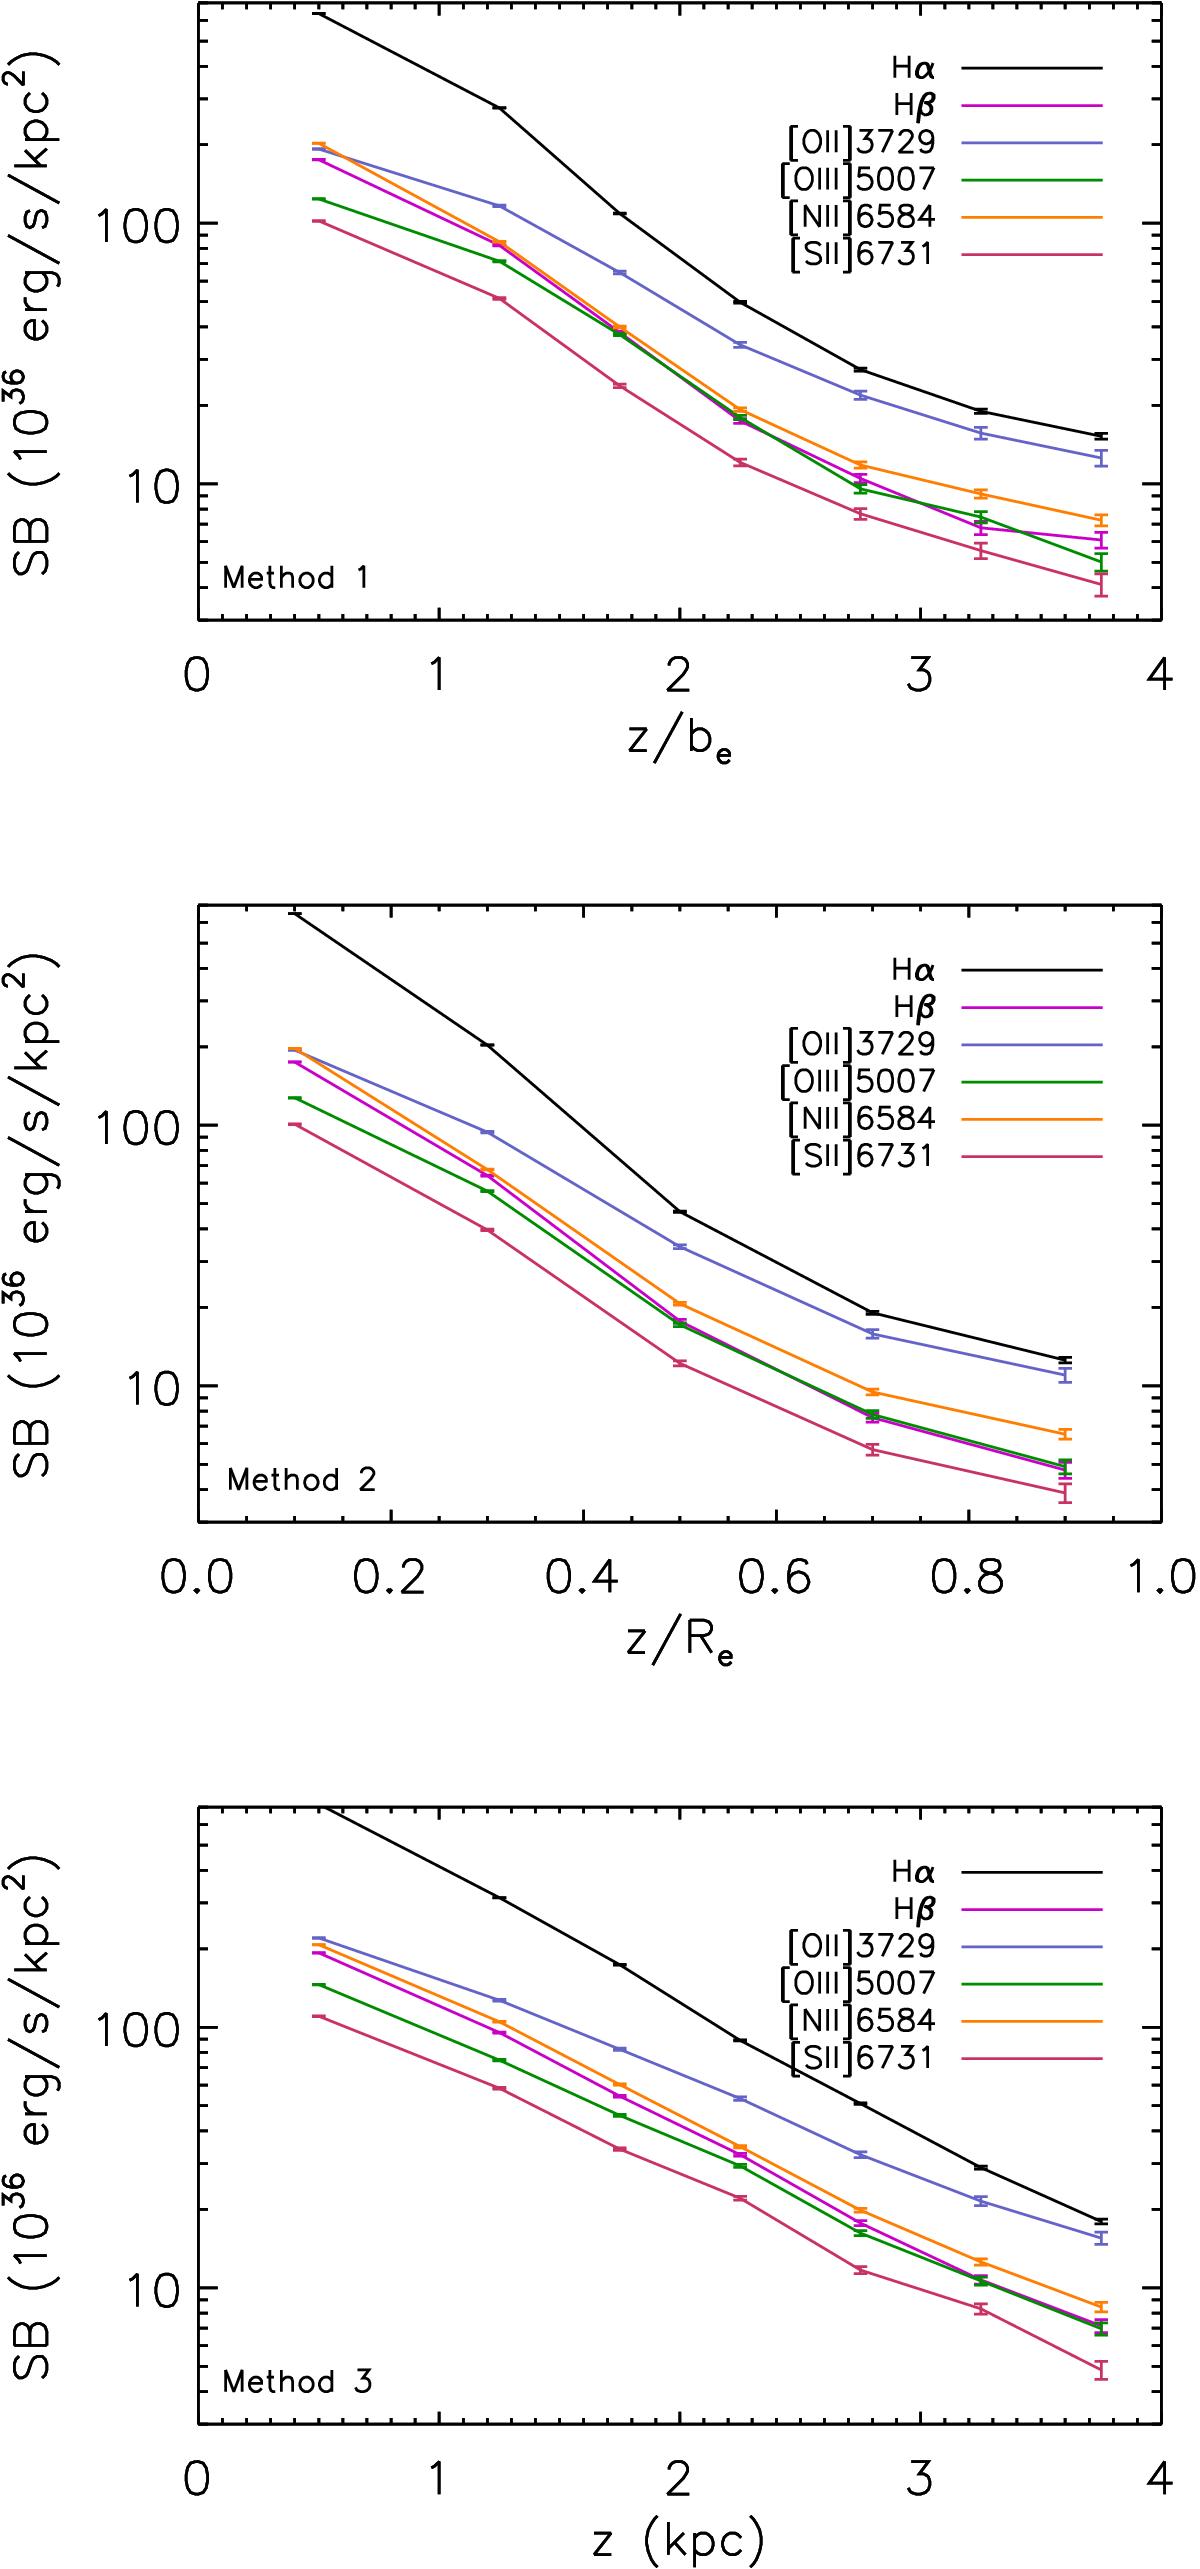
Surface brightness profiles of the six brightest emission lines (different colors) as a function of distance from the midplane for the full sample with the three different stacking methods. The errors are from the spectral fitting. Top panel is with Method 1, middle with Method 2, and the bottom is with Method 3, see Sect. 2.2 for details of these methods.
Current usage metrics show cumulative count of Article Views (full-text article views including HTML views, PDF and ePub downloads, according to the available data) and Abstracts Views on Vision4Press platform.
Data correspond to usage on the plateform after 2015. The current usage metrics is available 48-96 hours after online publication and is updated daily on week days.
Initial download of the metrics may take a while.