Fig. 5
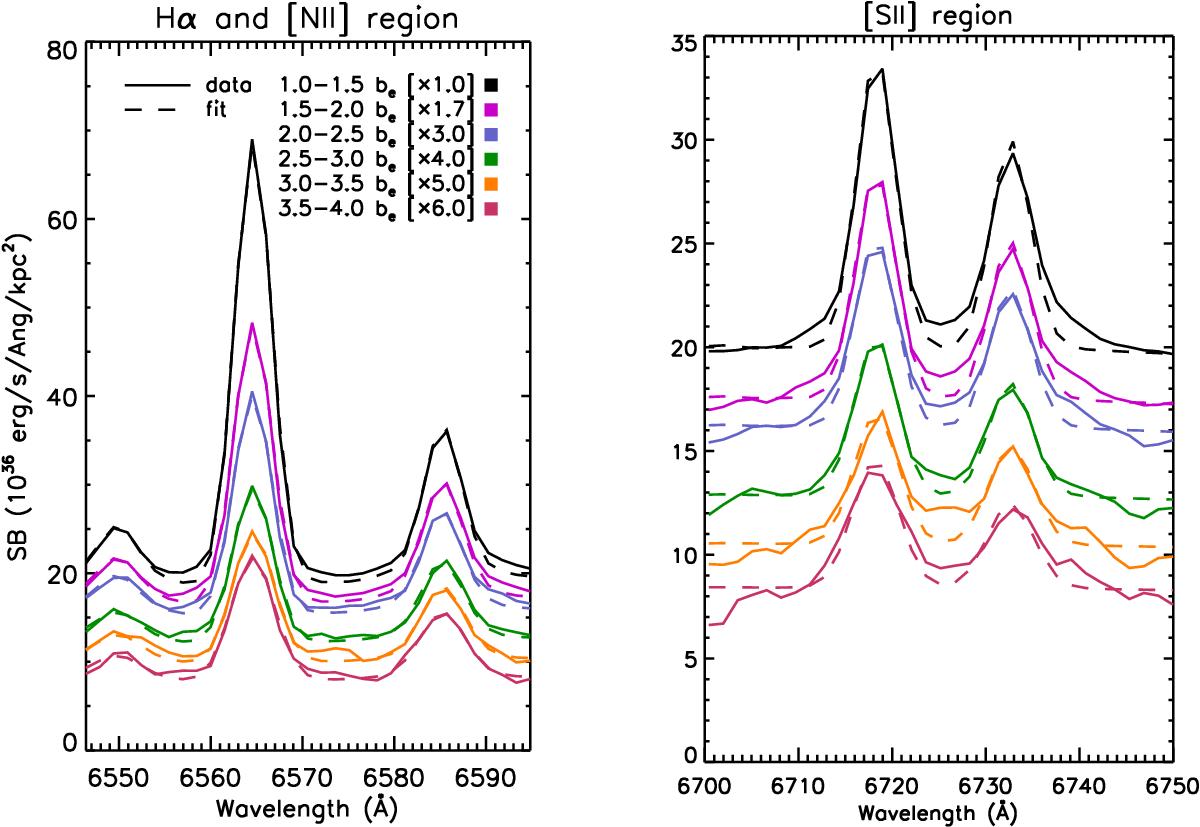
Enlargement of the emission lines for the full sample for various be bins using Method 1. The data is shown as the solid line and the emission line fits are the dashed lines, with the different colors corresponding to different be bins. The spectra have been scaled in the vertical direction for clarity, with the amount shown in the legend.
Current usage metrics show cumulative count of Article Views (full-text article views including HTML views, PDF and ePub downloads, according to the available data) and Abstracts Views on Vision4Press platform.
Data correspond to usage on the plateform after 2015. The current usage metrics is available 48-96 hours after online publication and is updated daily on week days.
Initial download of the metrics may take a while.