Fig. 4
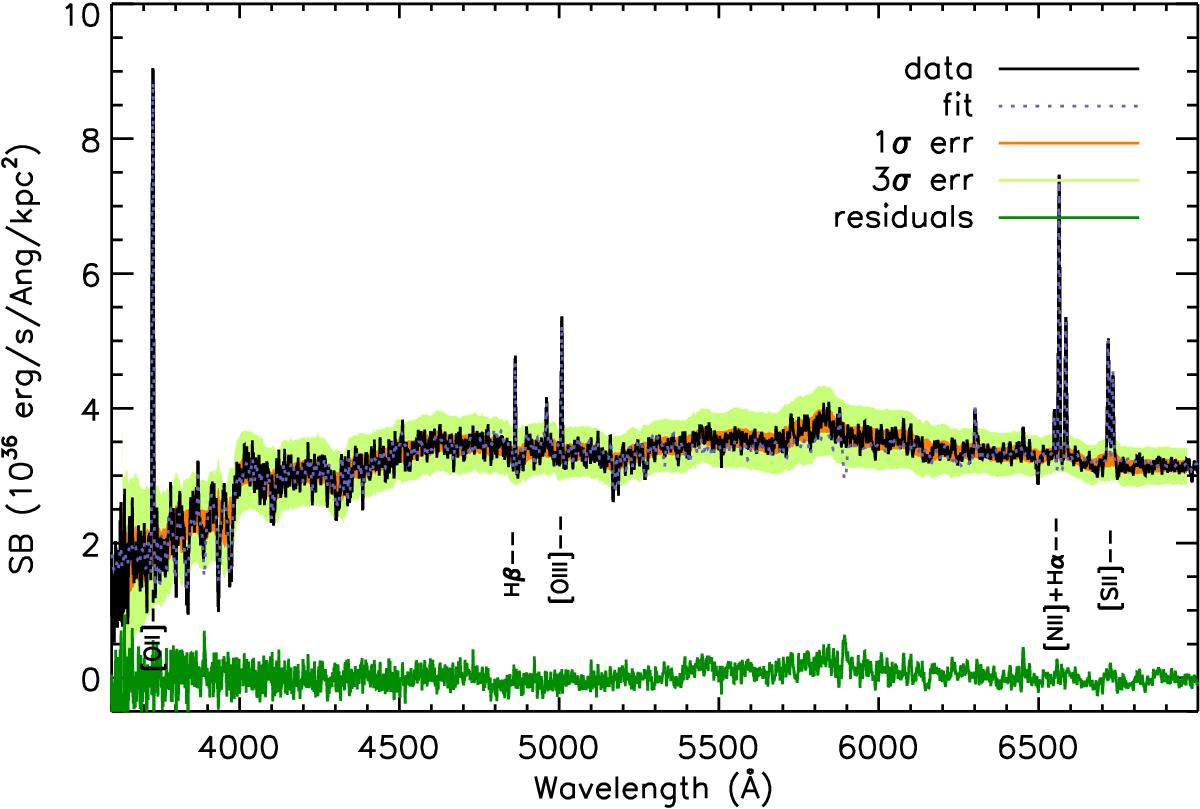
Example of the spectrum (in rest frame) obtained by stacking fibers from the full sample between 2.5 and 3.0 be (black solid). The 1 and 3σ errors on the continuum are shown in the orange and yellow bands. The best-fit model spectrum (blue dotted) is overplotted along with the residuals from the fit (green). The bright emission lines Hα, Hβ, [O ii], [O iii], [N ii], and [S ii], discussed in this paper, are labeled.
Current usage metrics show cumulative count of Article Views (full-text article views including HTML views, PDF and ePub downloads, according to the available data) and Abstracts Views on Vision4Press platform.
Data correspond to usage on the plateform after 2015. The current usage metrics is available 48-96 hours after online publication and is updated daily on week days.
Initial download of the metrics may take a while.