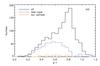
Fig. 2
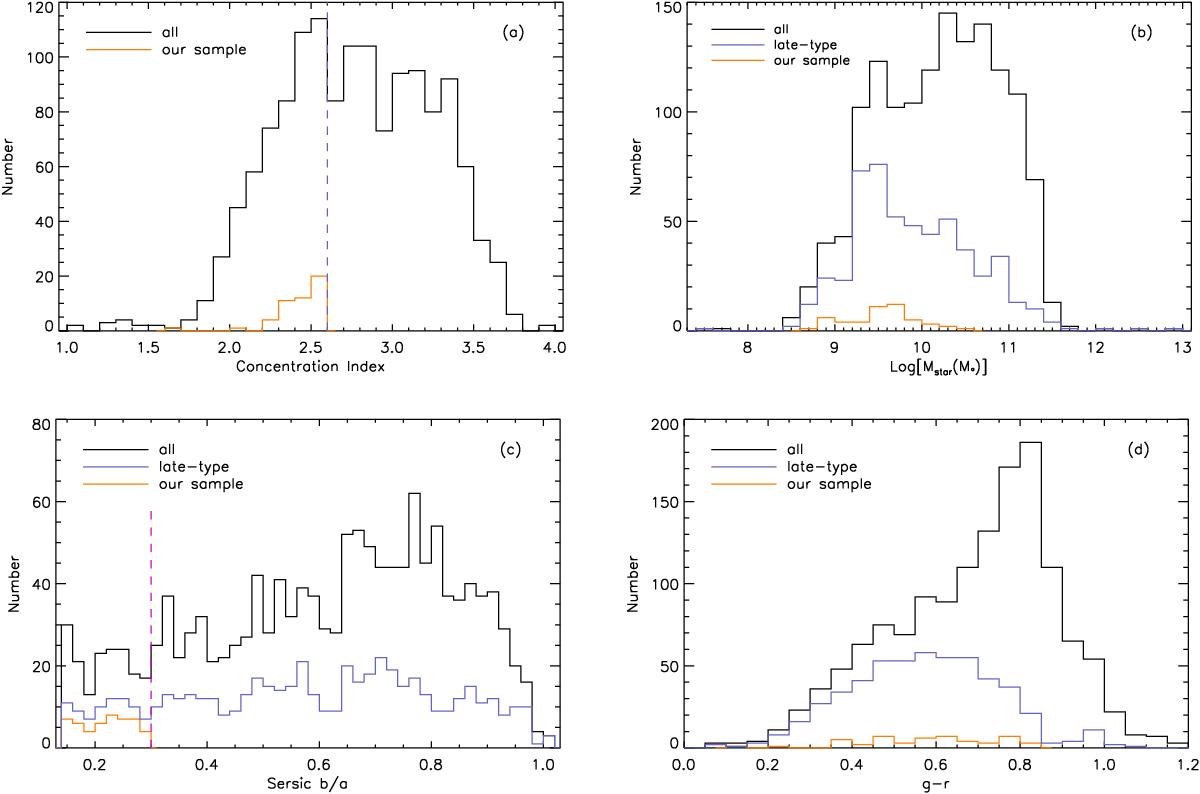
Histograms showing the distributions of the MaNGA first year sample (black) and our sample of galaxies (orange) for various galactic properties. Panel a) shows the distribution of concentration index C with the vertical dashed purple line showing the division between late-type and early-type galaxies at C = 2.6. Panel b) gives the Mstar for the full sample (black), late-type galaxies (blue) defined by C < 2.6, and our sample (orange). Panel c) shows the inclination distribution (given by b/a) for the same sets of galaxies with the vertical dashed line at our cutoff b/a = 0.3. Panel d) shows the distribution of g-r colors.
Current usage metrics show cumulative count of Article Views (full-text article views including HTML views, PDF and ePub downloads, according to the available data) and Abstracts Views on Vision4Press platform.
Data correspond to usage on the plateform after 2015. The current usage metrics is available 48-96 hours after online publication and is updated daily on week days.
Initial download of the metrics may take a while.