Fig. 1
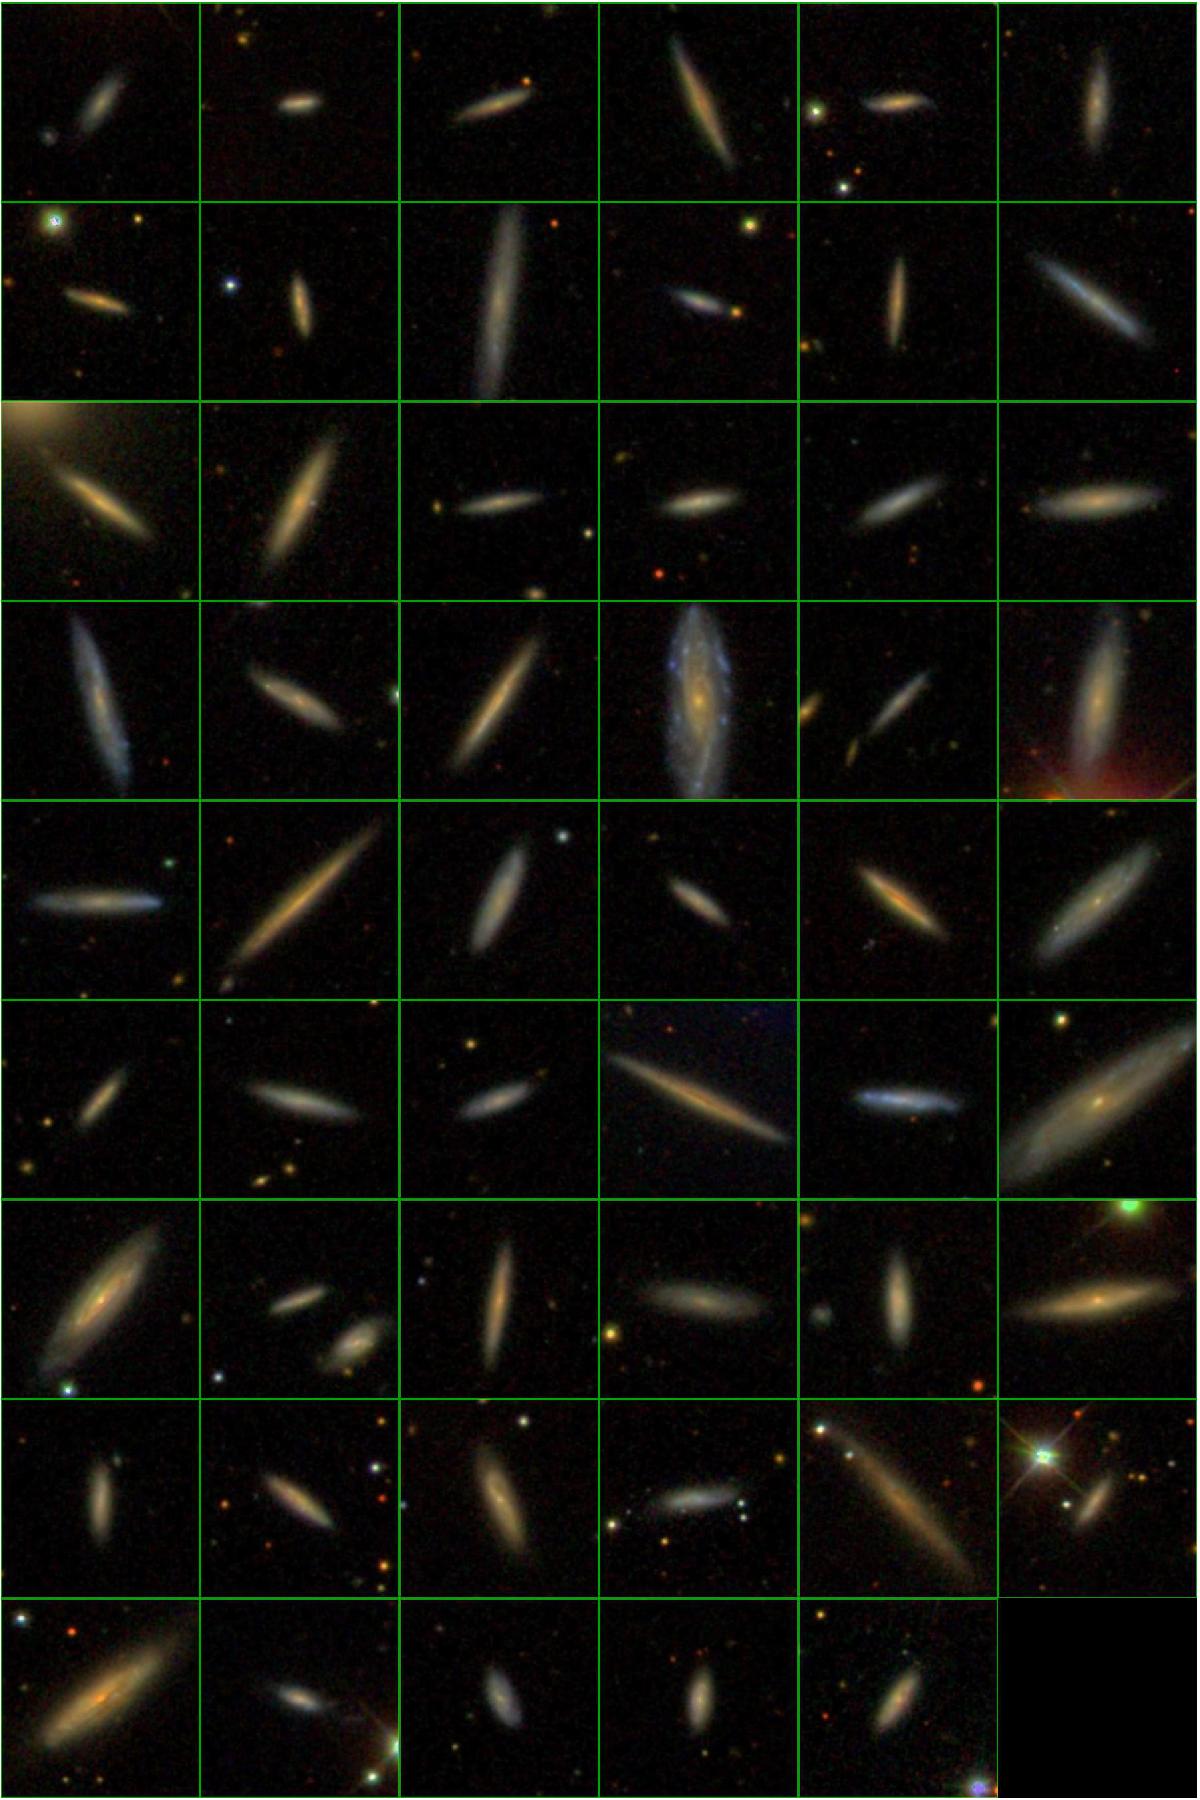
SDSS images of all the galaxies used in the analysis. The images are in the same order as Table A.1 (left to right, then top to bottom). Each box is 60 × 60 arcsec with the centers corresponding to the coordinates given in Table A.1. The four additional galaxies for the large-z sample are also included as the last four galaxies.
Current usage metrics show cumulative count of Article Views (full-text article views including HTML views, PDF and ePub downloads, according to the available data) and Abstracts Views on Vision4Press platform.
Data correspond to usage on the plateform after 2015. The current usage metrics is available 48-96 hours after online publication and is updated daily on week days.
Initial download of the metrics may take a while.