Fig. 9
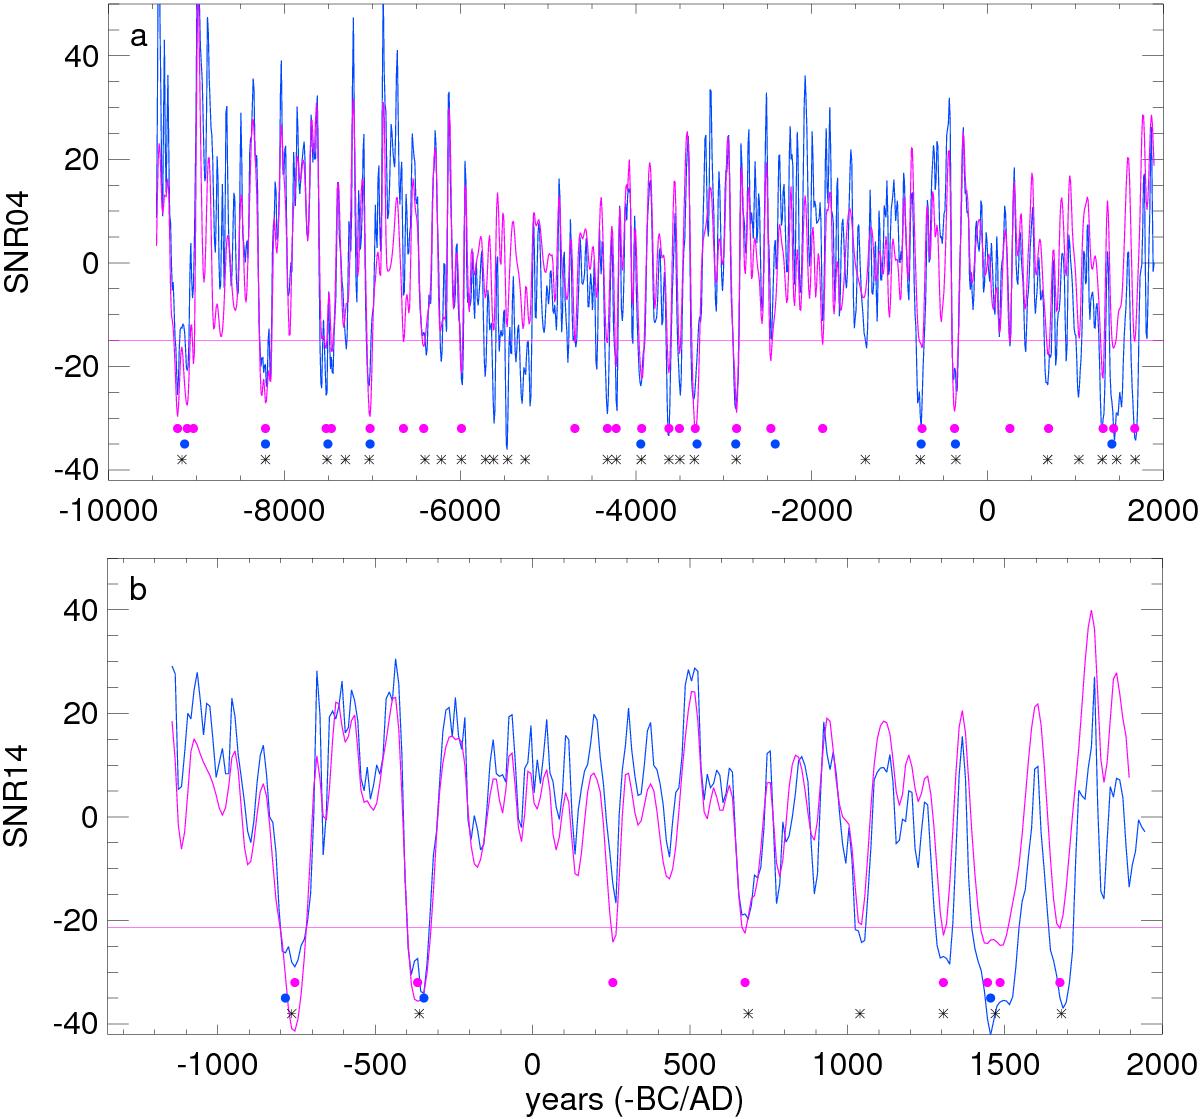
Sunspot number (blue line) for the two datasets SNR04 (panel a)) and SNR14 (panel b)) and respective empirical mode decomposition (magenta line) reconstructions through modes j = 1−4 (panel a)) and j = 1−5 (panel b)). Horizontal magenta lines indicate the 90th percentile of the EMD reconstruction distribution function. Magenta dots correspond to times when the EMD reconstructions (magenta lines) are beyond the 90th percentile of its distribution function. Blue dots mark grand minima also occurring in a relative minima of the Suess cycle (j = 3,4 for SNR04 and j = 4,5 for SNR14) exceeding the 90th percentile of the distribution function of this signal. Black asterisks correspond to the grand minima identified in Usoskin et al. (2007).
Current usage metrics show cumulative count of Article Views (full-text article views including HTML views, PDF and ePub downloads, according to the available data) and Abstracts Views on Vision4Press platform.
Data correspond to usage on the plateform after 2015. The current usage metrics is available 48-96 hours after online publication and is updated daily on week days.
Initial download of the metrics may take a while.