Free Access
Fig. 7
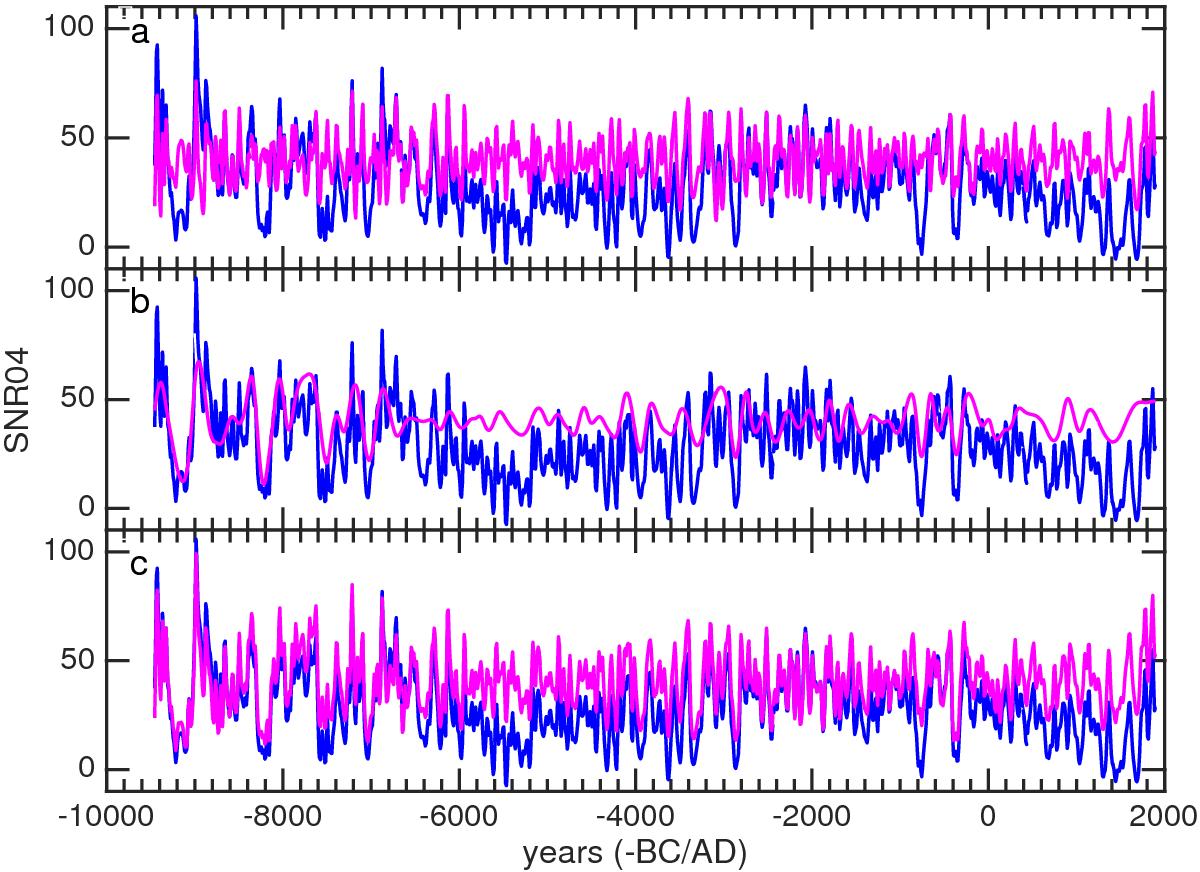
Empirical mode decomposition reconstructions (magenta lines) superimposed to the sunspot number SNR04 dataset (blue lines). The shown reconstructions are obtained by summing up modes j = 0−2 (panel a)), j = 3,4 (panel b)), and j = 0−4 (panel c)) and by adding an offset of 40.
Current usage metrics show cumulative count of Article Views (full-text article views including HTML views, PDF and ePub downloads, according to the available data) and Abstracts Views on Vision4Press platform.
Data correspond to usage on the plateform after 2015. The current usage metrics is available 48-96 hours after online publication and is updated daily on week days.
Initial download of the metrics may take a while.