Fig. 2
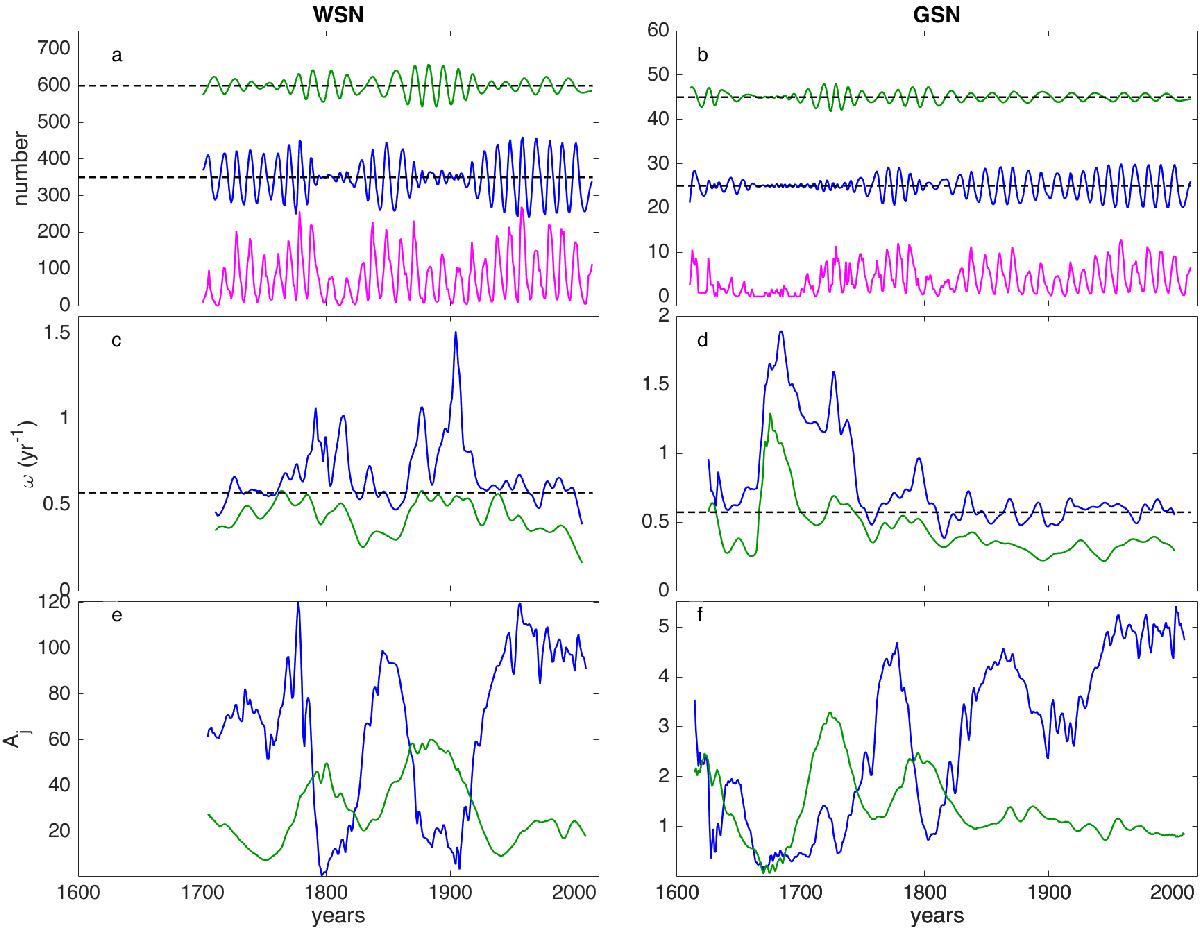
Comparison between the two sunspot number datasets, Wolf sunspot number (WSN) and group sunspot number (GSN), and the respective empirical mode decomposition results for modes j = 1,2. Panels a), b): WSN and GSN data (magenta) and intrinsic mode functions ψ1 (blue) and ψ2 (green) for WSN and GSN data. ψ1 and ψ2 are offset from the zero value by 350, 600 for WSN and 25, 45 for GSN. Panels c), d): instantaneous frequencies ω1 (blue) and ω2 (green) of the j = 1,2 modes for WSN and GSN data. The horizontal black dashed line indicates the 11 yr frequency. Panels d), e): instantaneous amplitudes A1 (blue) and A2 (green) of the j = 1,2 modes for WSN and GSN data.
Current usage metrics show cumulative count of Article Views (full-text article views including HTML views, PDF and ePub downloads, according to the available data) and Abstracts Views on Vision4Press platform.
Data correspond to usage on the plateform after 2015. The current usage metrics is available 48-96 hours after online publication and is updated daily on week days.
Initial download of the metrics may take a while.