Fig. 10
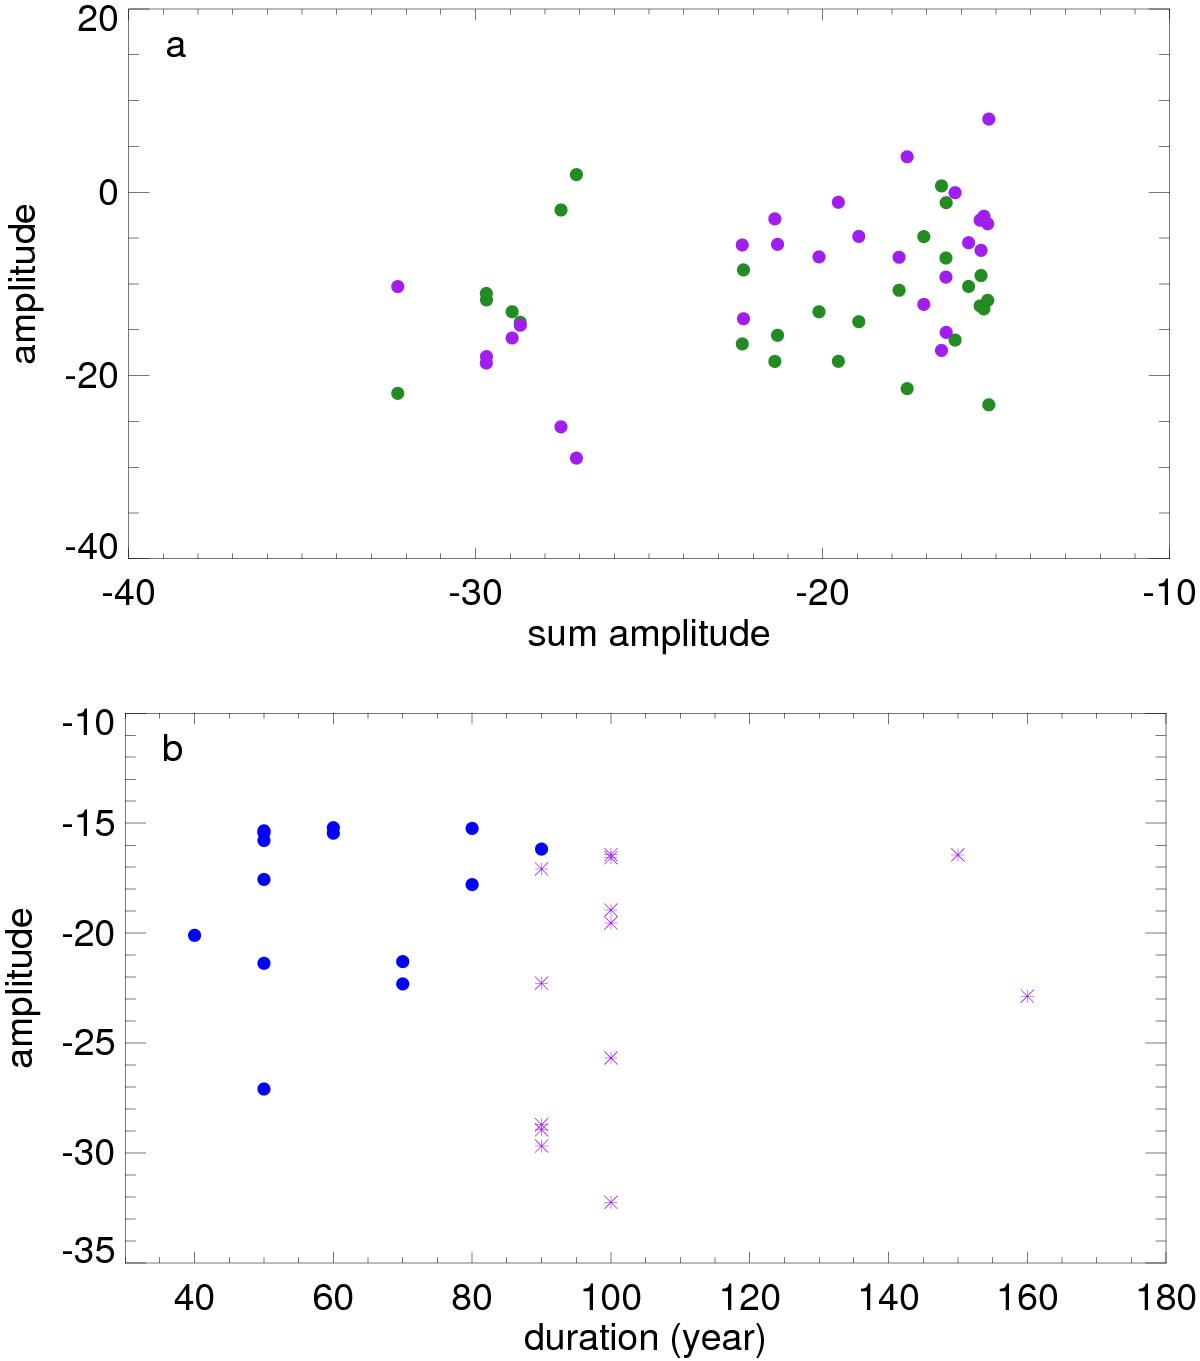
Panel a): amplitude of the Gleissberg (green dots) and Suess (purple dots) cycles, reconstructed through the empirical mode decomposition (see text for details), at grand minima as a function of the amplitude of their sum at the same times. Panel b): grand minima amplitudes as a function of their duration. Asterisks indicate grand minima occurring at a minimum of the Suess cycle.
Current usage metrics show cumulative count of Article Views (full-text article views including HTML views, PDF and ePub downloads, according to the available data) and Abstracts Views on Vision4Press platform.
Data correspond to usage on the plateform after 2015. The current usage metrics is available 48-96 hours after online publication and is updated daily on week days.
Initial download of the metrics may take a while.