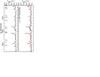
Fig. 6
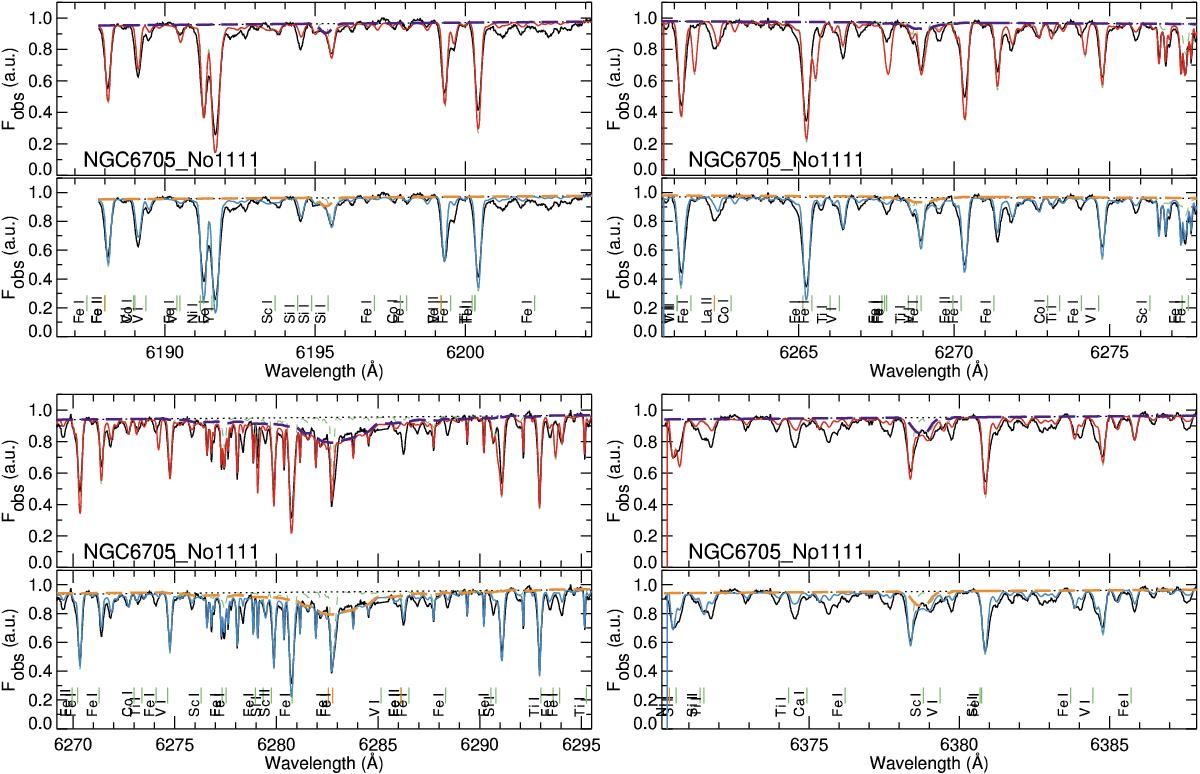
NGC 6705_No1111 as an example of fit in the spectral region for each DIB. Total spectra are represented with solid lines as follows: black – observed spectra; red – fit with original line list; blue – fit with updated line list. Components associated with the modeled DIBs are shown with long-dashed violet and orange lines, while the synthetic spectra as created by TURBOSPECTRUM appear as green short-dashed lines.
Current usage metrics show cumulative count of Article Views (full-text article views including HTML views, PDF and ePub downloads, according to the available data) and Abstracts Views on Vision4Press platform.
Data correspond to usage on the plateform after 2015. The current usage metrics is available 48-96 hours after online publication and is updated daily on week days.
Initial download of the metrics may take a while.