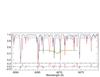
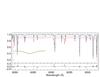
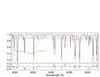
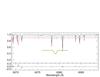
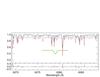
Fig. 1
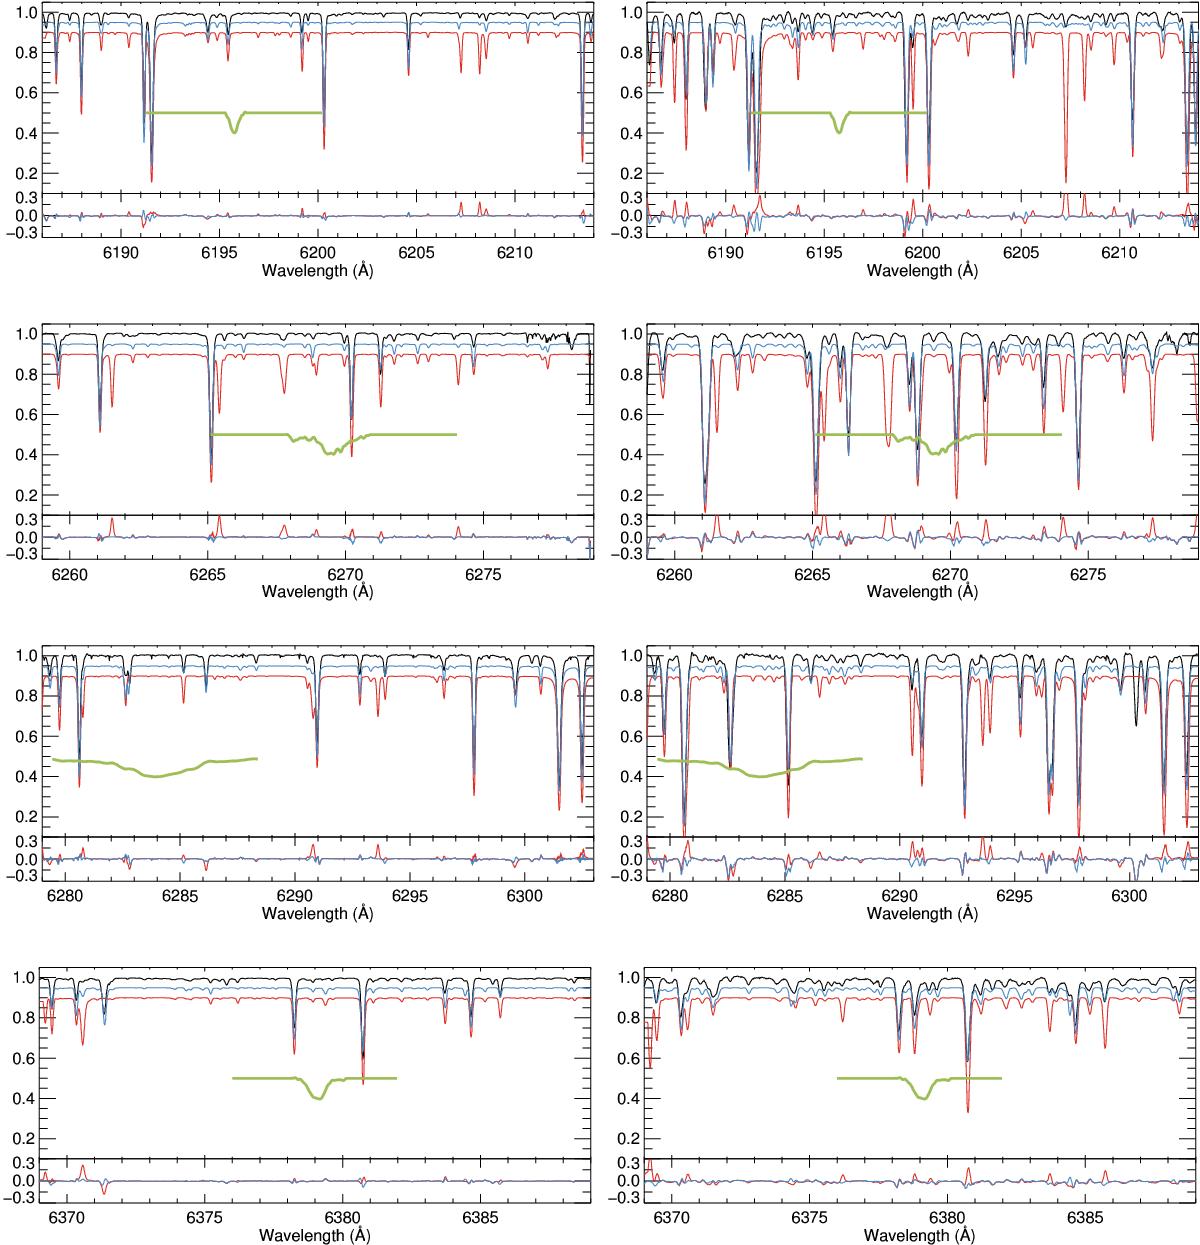
Comparison of the modeled spectra of the Sun (left) and Arcturus (right). Each panel contains two graphics. In the main (upper) panel, the black line indicates the observed spectrum. The red and blue lines show the modeled spectrum using the original and improved line list, respectively. For the sake of clarity, these two lines have been offset by −0.10 and −0.05 in the y-axis. In the complementary (lower) panel, the residuals (data – model) using both line lists are shown. Finally, the profiles for the DIBs that motivated the corrections presented here and a putative cloud at v = 0 km s-1 are included for reference.
Current usage metrics show cumulative count of Article Views (full-text article views including HTML views, PDF and ePub downloads, according to the available data) and Abstracts Views on Vision4Press platform.
Data correspond to usage on the plateform after 2015. The current usage metrics is available 48-96 hours after online publication and is updated daily on week days.
Initial download of the metrics may take a while.