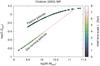
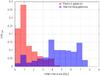
Fig. 4
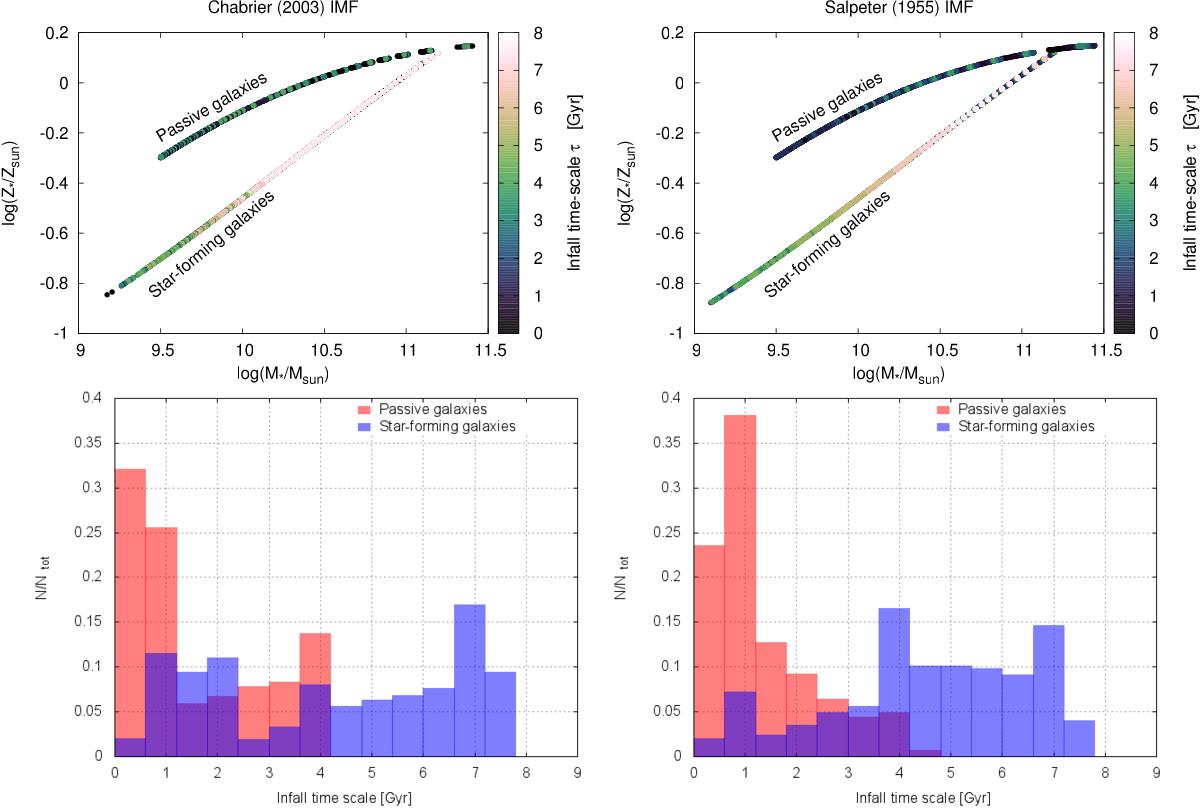
Upper panels: MZ relation by Peng et al. (2015) (fitted by third-order polynomial functions shown in Fig. 3) for passive and star-forming galaxies. We reproduce it using the new analytical solution presented in this paper and vary different parameter models. In this figure we focus on the timescale parameter τ, and the color code indicates different τ values of the computed galaxies that reside along the MZ relations. In the left panel we adopt a Chabrier (2003) IMF, whereas in the right panel the Salpeter (1955) IMF is assumed. Lower panels: distribution of the predicted passive galaxies (red histogram) and star-forming galaxies (blue histogram) that reproduced the MZ relation in terms of the timescale parameter τ with a Chabrier (2003) IMF (left panel) and a Salpeter (1955) IMF (right panel).
Current usage metrics show cumulative count of Article Views (full-text article views including HTML views, PDF and ePub downloads, according to the available data) and Abstracts Views on Vision4Press platform.
Data correspond to usage on the plateform after 2015. The current usage metrics is available 48-96 hours after online publication and is updated daily on week days.
Initial download of the metrics may take a while.