Fig. 4
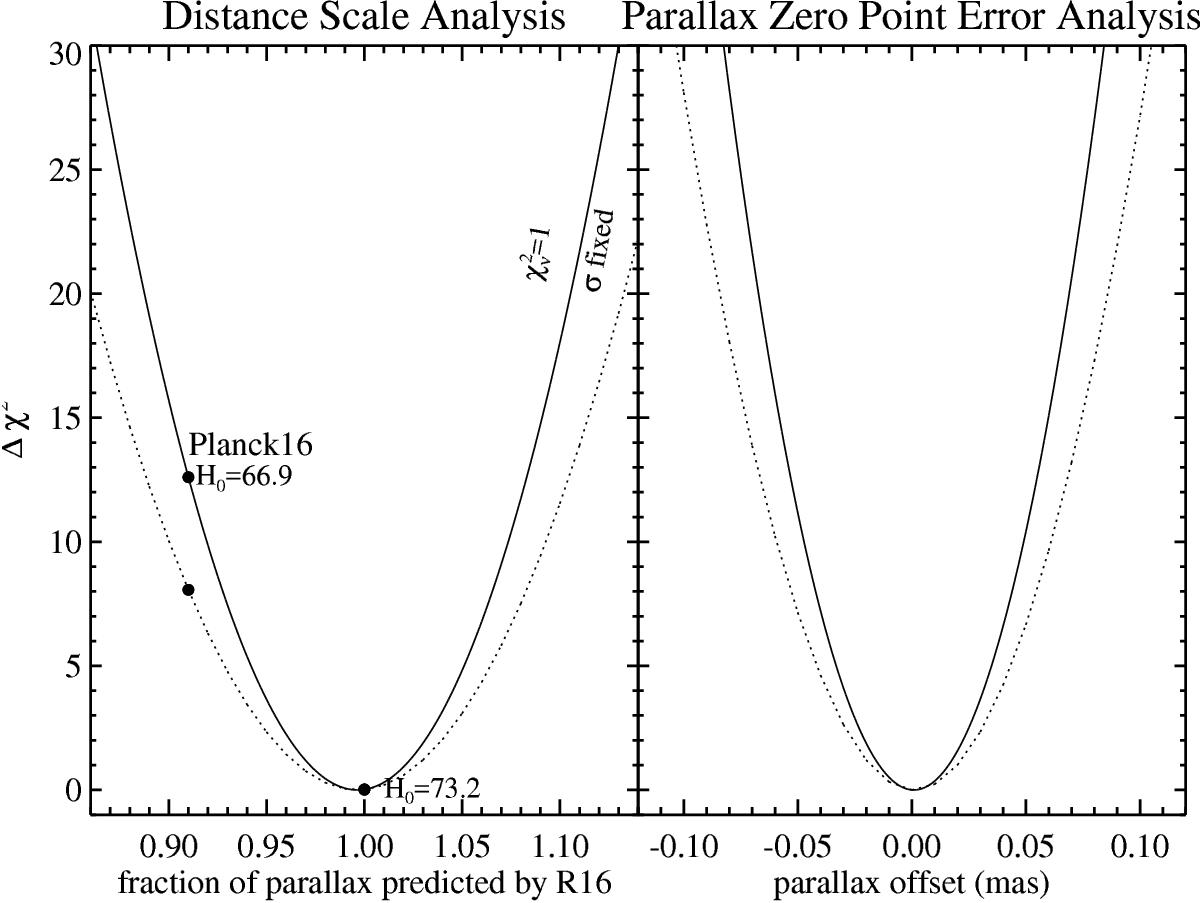
Comparing Gaia and predicted parallaxes to test either the distance scale or the parallax zero point. Shown is the change in χ2 caused by a multiplicative term in the photometric parallaxes (left panel) or an additive term in DR1 parallaxes (right panel). In each panel, the dashed curve uses the nominal errors, while the solid curve is for errors scaled by a factor 0.80, as suggested in order to obtain χ2 = 1 per degree of freedom. See text for more discussion.
Current usage metrics show cumulative count of Article Views (full-text article views including HTML views, PDF and ePub downloads, according to the available data) and Abstracts Views on Vision4Press platform.
Data correspond to usage on the plateform after 2015. The current usage metrics is available 48-96 hours after online publication and is updated daily on week days.
Initial download of the metrics may take a while.