Fig. 3
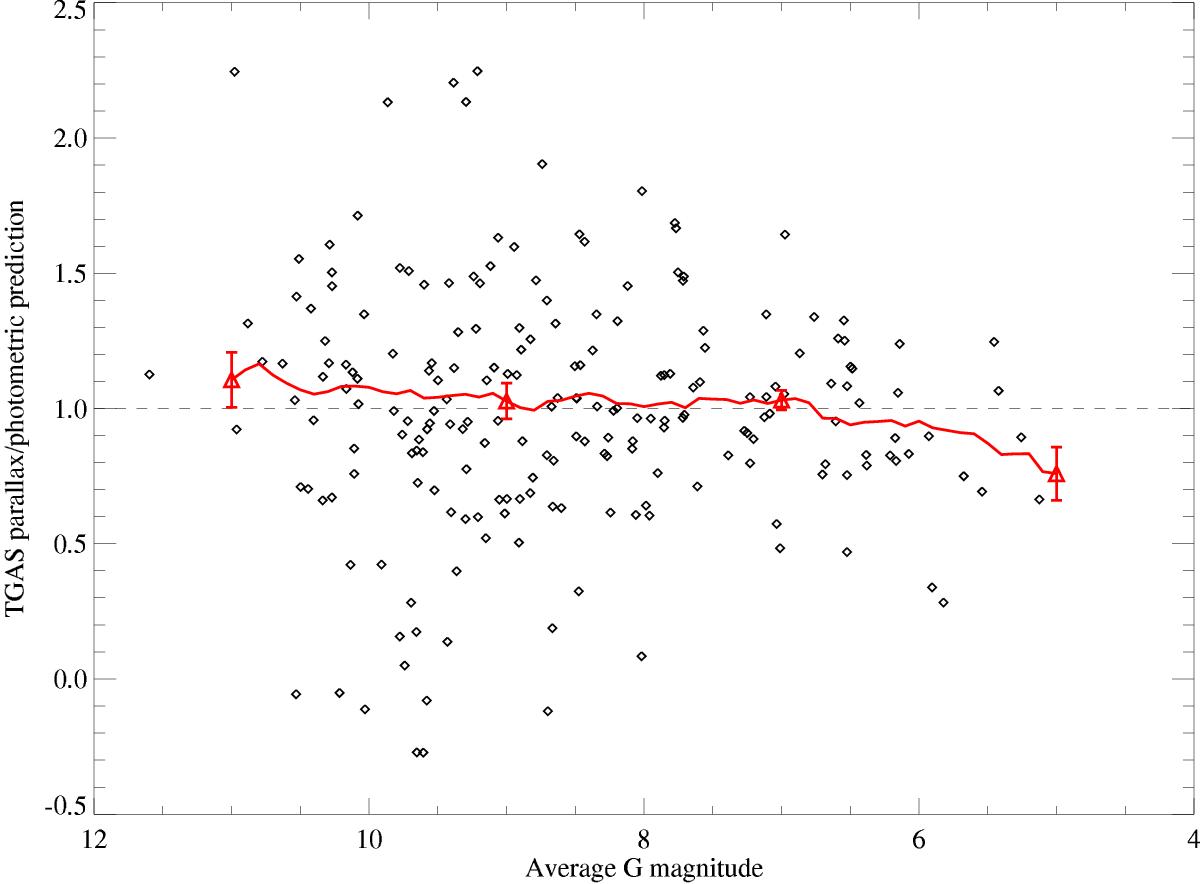
Ratio between TGAS and photometric parallaxes as a function of average G magnitude as given in the DR1 data. The red symbols show the mean and the error in the mean (based on the actual dispersion, not the nominal errors) for bins 2 mag wide; the red line shows the mean ratio in moving bins 2 mag wide centered at the magnitude in the abscissa. Note that three stars exceed the range of the Y axis and are not shown, but are included in the averages. This comparison suggests that TGAS parallaxes for very bright stars (G< 6), for which the central pixel will typically be saturated even at the shortest gating used, may be systematically underestimated.
Current usage metrics show cumulative count of Article Views (full-text article views including HTML views, PDF and ePub downloads, according to the available data) and Abstracts Views on Vision4Press platform.
Data correspond to usage on the plateform after 2015. The current usage metrics is available 48-96 hours after online publication and is updated daily on week days.
Initial download of the metrics may take a while.