Fig. A.1
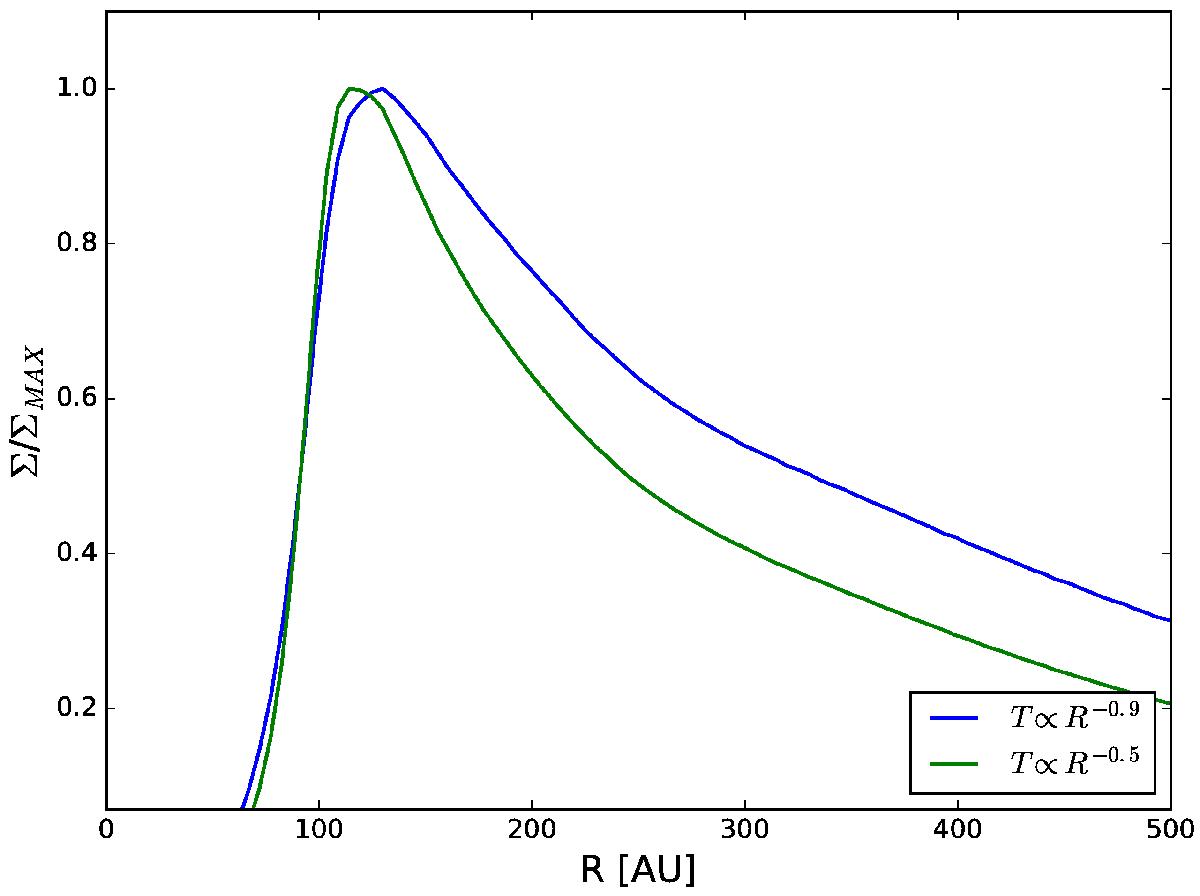
Azimuthally and temporally averaged gas radial density profiles, obtained using α = 0.01 and two different temperature profiles. As expected, the density profile resulting from the T ∝ R-0.5 is steeper than the T ∝ R-0.9 profile, and the density maximum in the first case is even farther away from the observed dust location (~ 200 AU) than in the latter case. Both density profiles are normalized to their maximum values.
Current usage metrics show cumulative count of Article Views (full-text article views including HTML views, PDF and ePub downloads, according to the available data) and Abstracts Views on Vision4Press platform.
Data correspond to usage on the plateform after 2015. The current usage metrics is available 48-96 hours after online publication and is updated daily on week days.
Initial download of the metrics may take a while.