Fig. 5
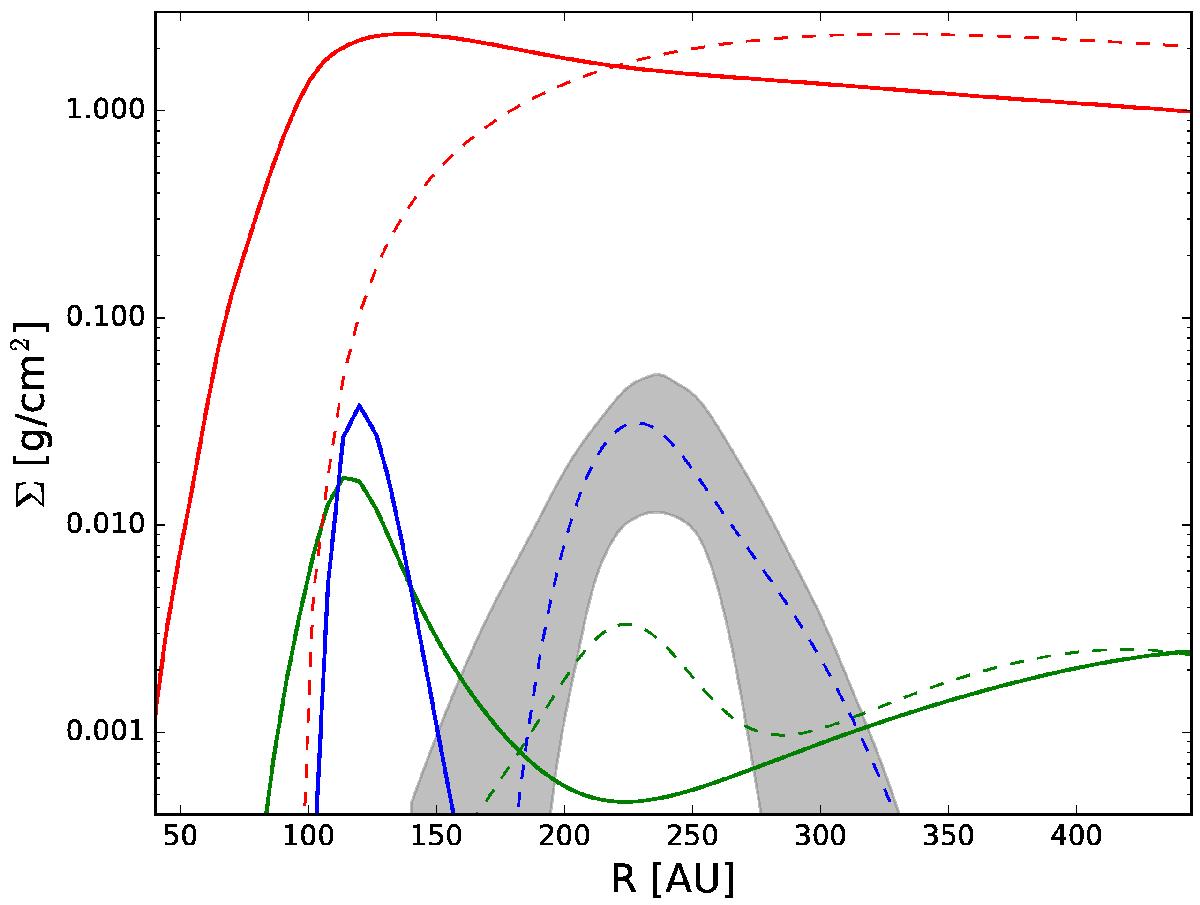
Density profiles for gas (solid red line) and dust (solid blue for mm-sized and solid green for micron-sized) obtained from our simulations in the coplanar case using α = 0.002. The gas and dust density profiles from the model by Andrews et al. (2014) are also plotted (dashed lines) for comparison. It is clear that the solid blue line showing the mm-sized dust surface density profile is not consistent with the data (gray shaded area).
Current usage metrics show cumulative count of Article Views (full-text article views including HTML views, PDF and ePub downloads, according to the available data) and Abstracts Views on Vision4Press platform.
Data correspond to usage on the plateform after 2015. The current usage metrics is available 48-96 hours after online publication and is updated daily on week days.
Initial download of the metrics may take a while.