Free Access
Fig. 2
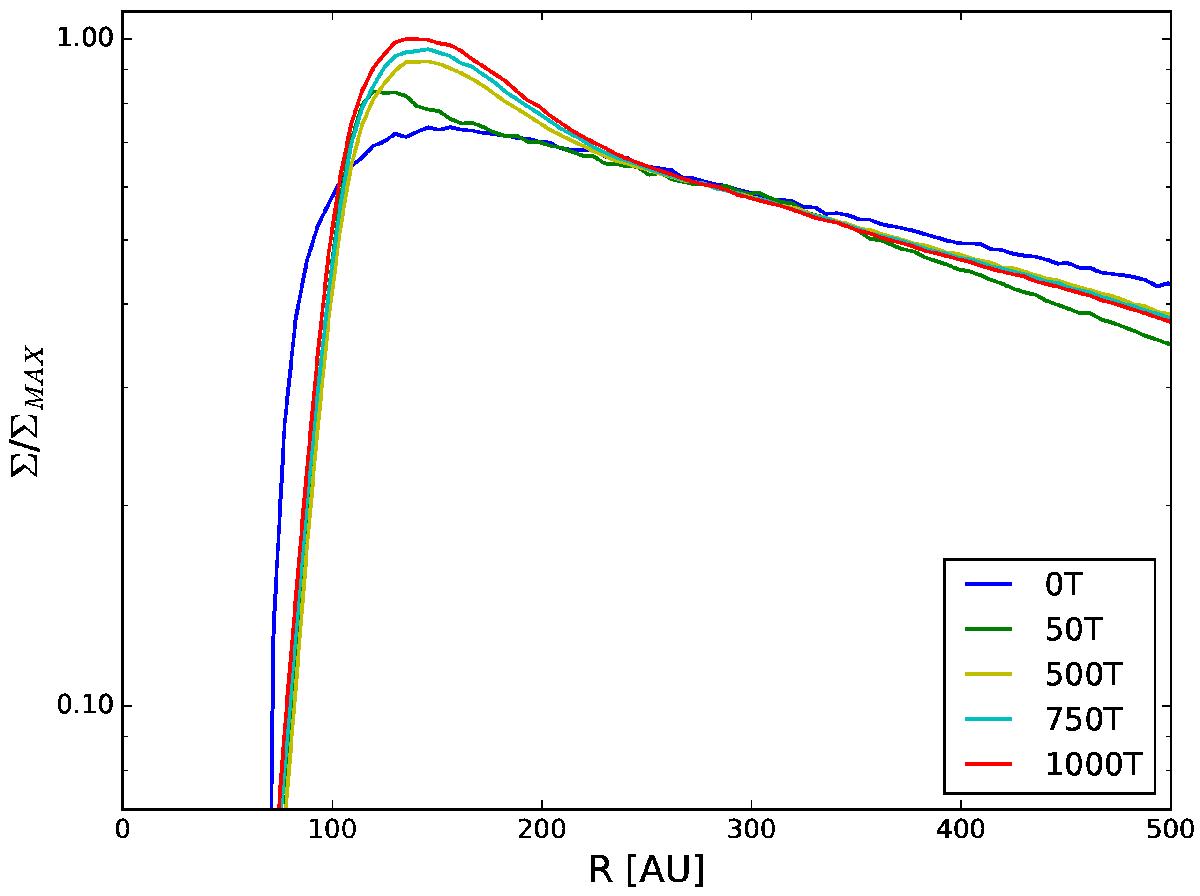
Azimuthally averaged gas density profile for the α = 0.002 simulation at different evolutionary stages. After a few hundred binary orbits the density profile reaches a quasi-stationary configuration. All the density profiles are normalized to the maximum of the density profile at the end of the simulation.
Current usage metrics show cumulative count of Article Views (full-text article views including HTML views, PDF and ePub downloads, according to the available data) and Abstracts Views on Vision4Press platform.
Data correspond to usage on the plateform after 2015. The current usage metrics is available 48-96 hours after online publication and is updated daily on week days.
Initial download of the metrics may take a while.