Fig. 1
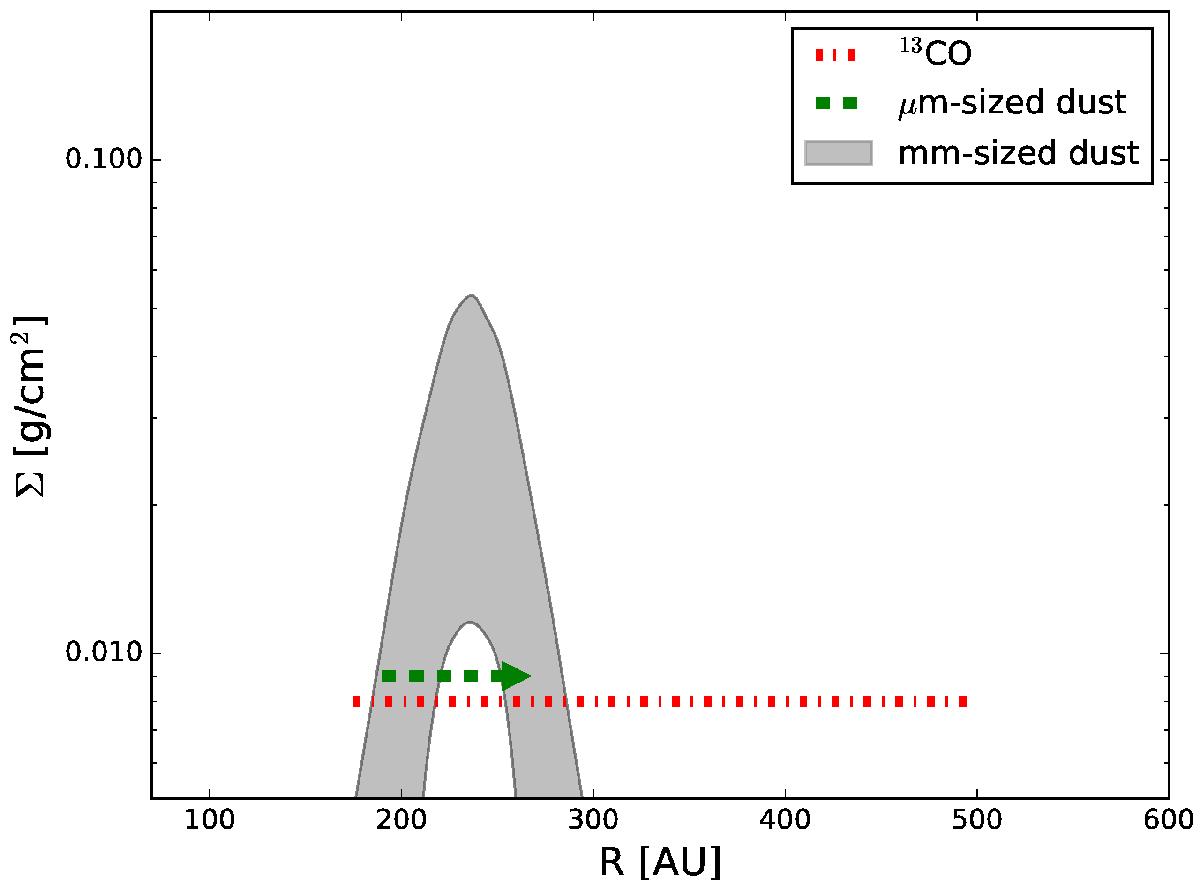
Observational constraints available to date for different sized grains and for CO distribution. The gray-shaded area shows the 2σ uncertainty on the mm-sized dust radial density profile as modeled in Andrews et al. (2014). The red dash-dotted and the green dashed lines show the radial extent of CO and micron-sized dust grains, respectively. It should be noted that these two tracers are optically thick and do not provide information about the density profile. The vertical location of the lines is therefore arbitrary.
Current usage metrics show cumulative count of Article Views (full-text article views including HTML views, PDF and ePub downloads, according to the available data) and Abstracts Views on Vision4Press platform.
Data correspond to usage on the plateform after 2015. The current usage metrics is available 48-96 hours after online publication and is updated daily on week days.
Initial download of the metrics may take a while.