Fig. 9
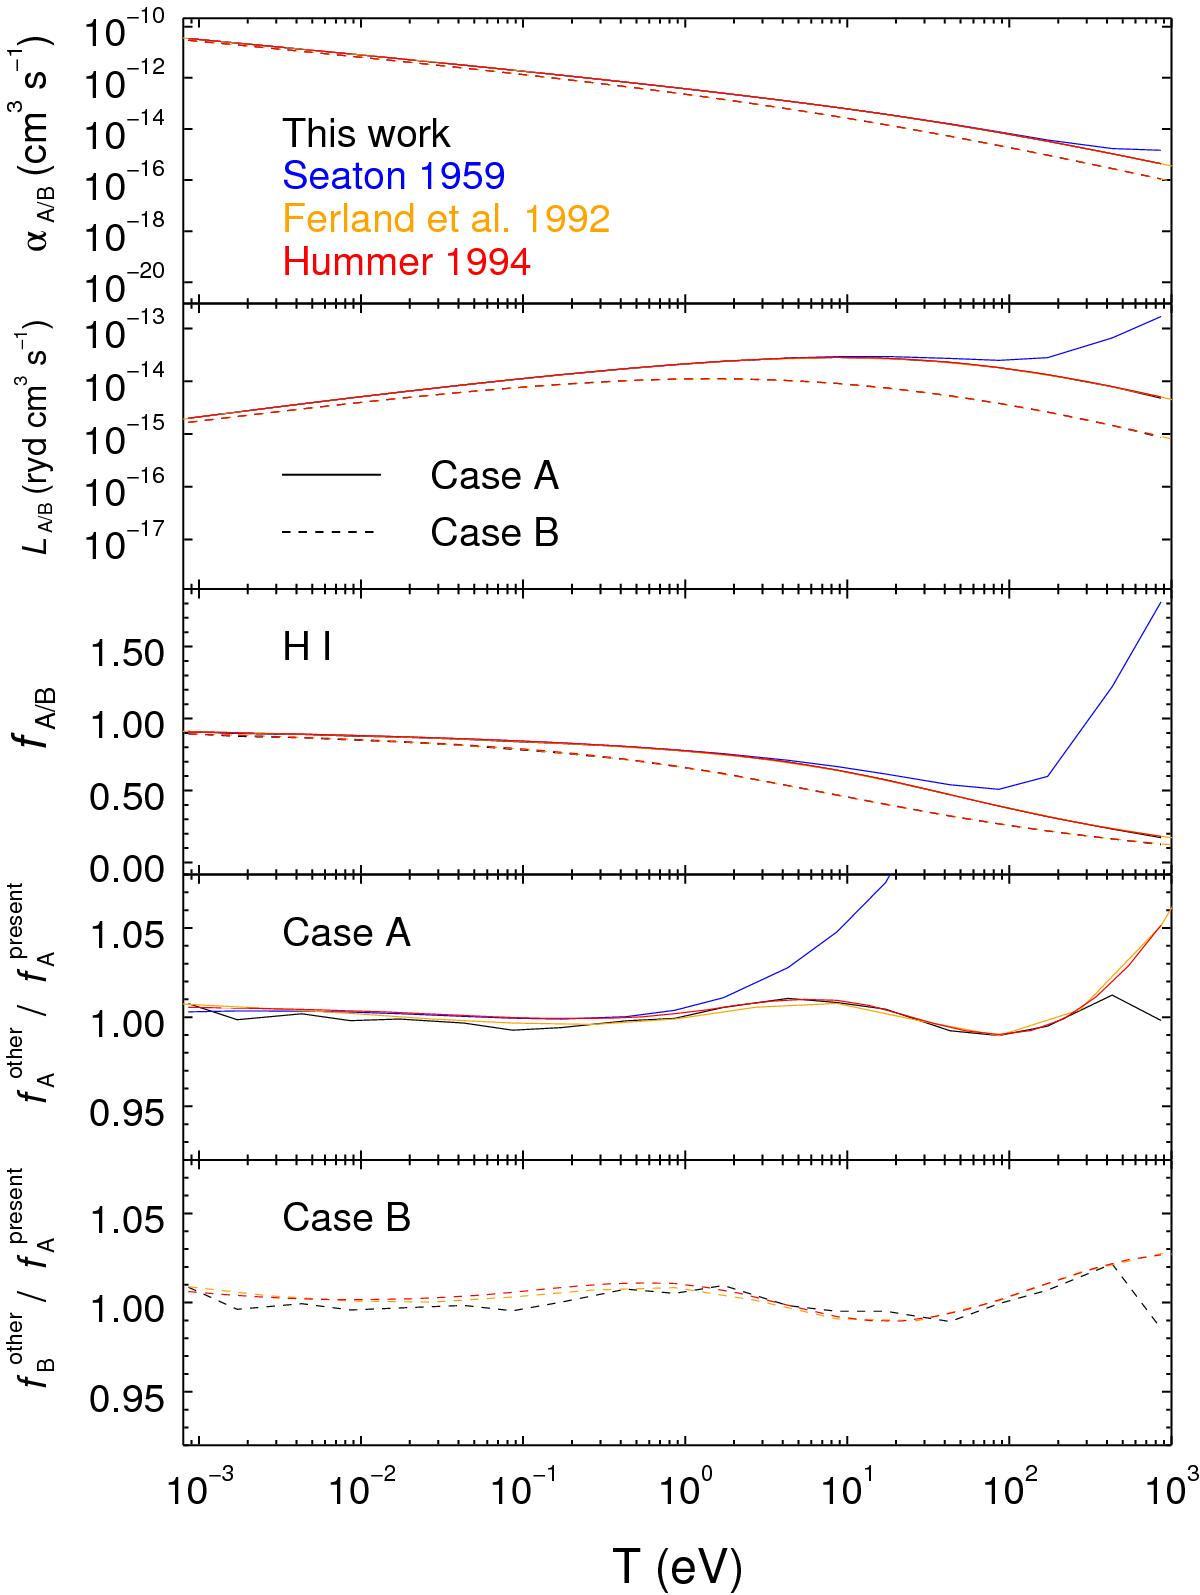
Comparison of the RR data for H i among results from this work (black), Seaton (1959, blue), Ferland et al. (1992, orange), and Hummer (1994, red). Both results of case A (solid lines) and case B (dashed lines) are shown. The total RR rates (![]() ) and electron energy loss rates (
) and electron energy loss rates (![]() ) are shown in the top two panels. The RR weighted electron energy loss factors (fA / B) are shown in the middle panel. The ratios of fA / B from this work and previous works with respect to the fitting results (Eq. (7) and Table 2) of this work, i.e.,
) are shown in the top two panels. The RR weighted electron energy loss factors (fA / B) are shown in the middle panel. The ratios of fA / B from this work and previous works with respect to the fitting results (Eq. (7) and Table 2) of this work, i.e., ![]() , are shown in the bottom two panels.
, are shown in the bottom two panels.
Current usage metrics show cumulative count of Article Views (full-text article views including HTML views, PDF and ePub downloads, according to the available data) and Abstracts Views on Vision4Press platform.
Data correspond to usage on the plateform after 2015. The current usage metrics is available 48-96 hours after online publication and is updated daily on week days.
Initial download of the metrics may take a while.