Free Access
Fig. 4
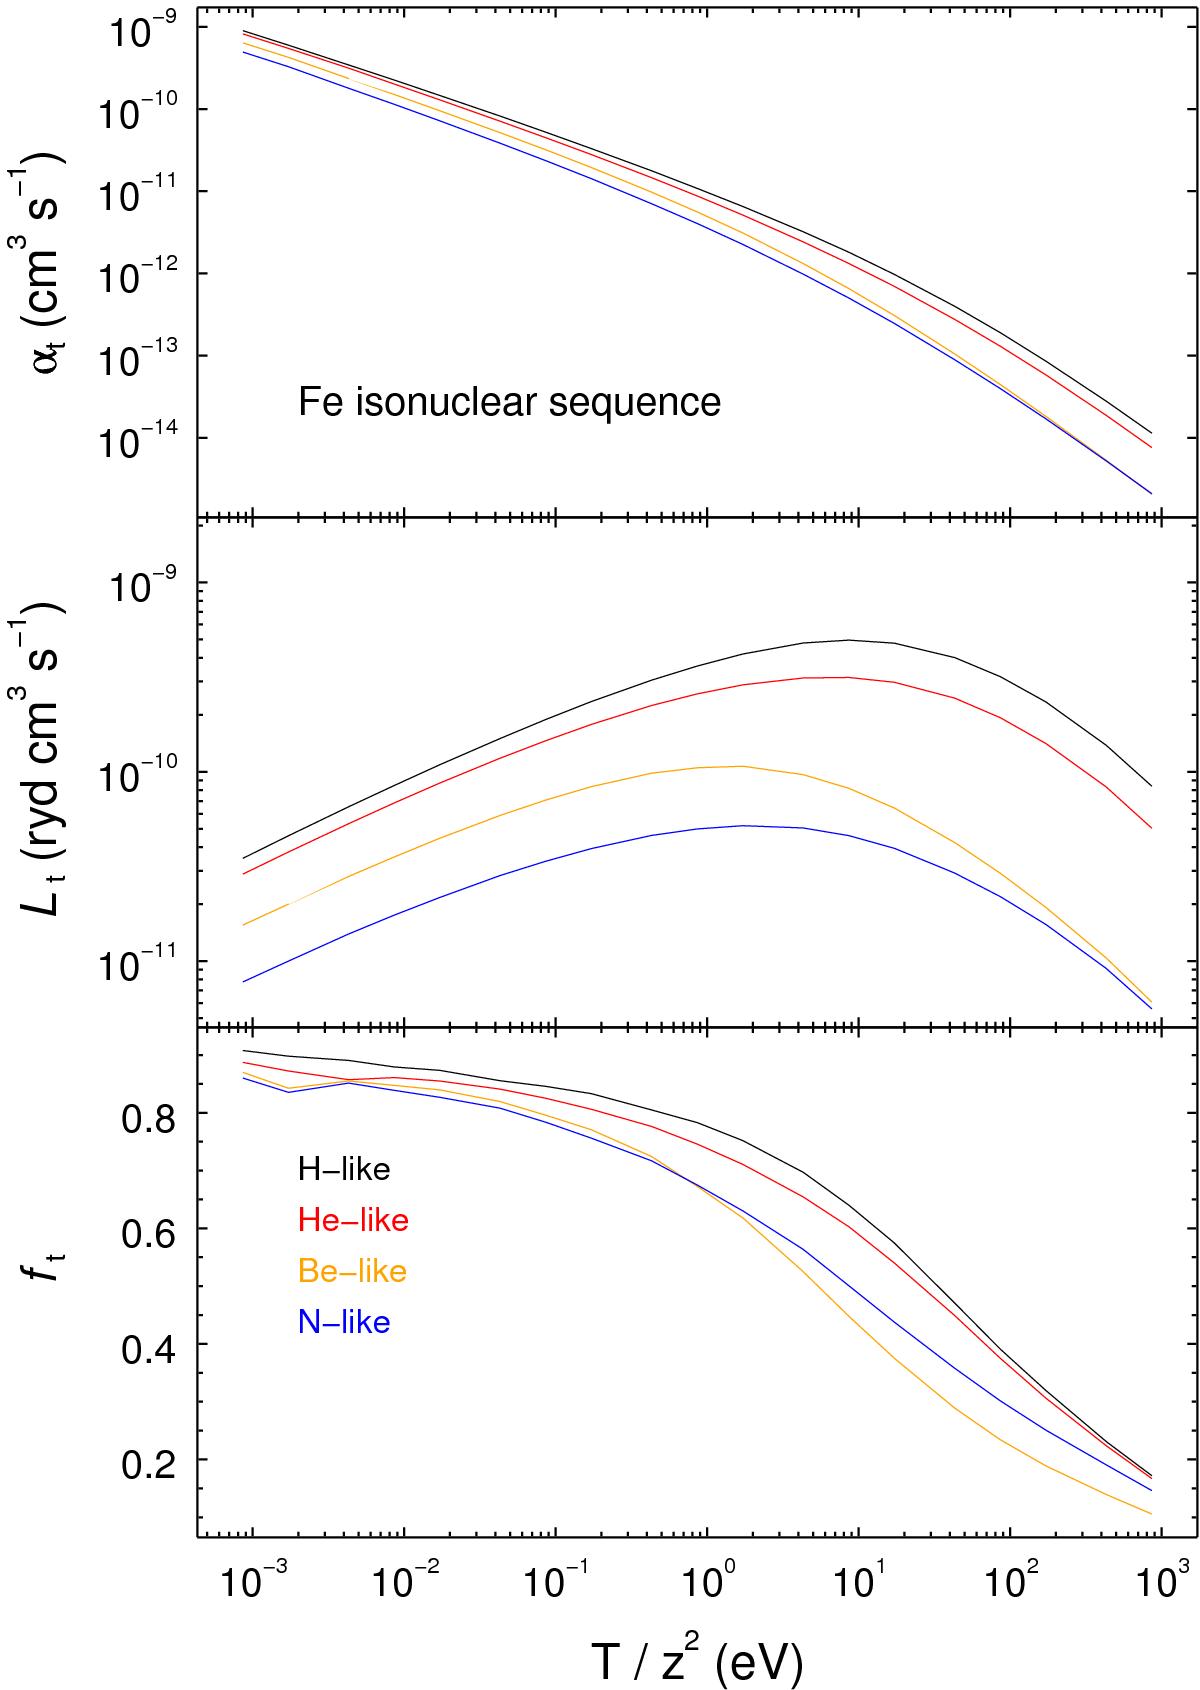
Top panel is total RR rates αt of the Fe isonuclear sequence, including H- (black), He- (red), Be- (orange) and N-like (blue); middle panel is the RR electron energy loss rates Lt; and the bottom panel is the weighted electron energy loss factors ft. The temperature of the plasma is downscaled by z2, as in Fig. 3.
Current usage metrics show cumulative count of Article Views (full-text article views including HTML views, PDF and ePub downloads, according to the available data) and Abstracts Views on Vision4Press platform.
Data correspond to usage on the plateform after 2015. The current usage metrics is available 48-96 hours after online publication and is updated daily on week days.
Initial download of the metrics may take a while.