Fig. 9
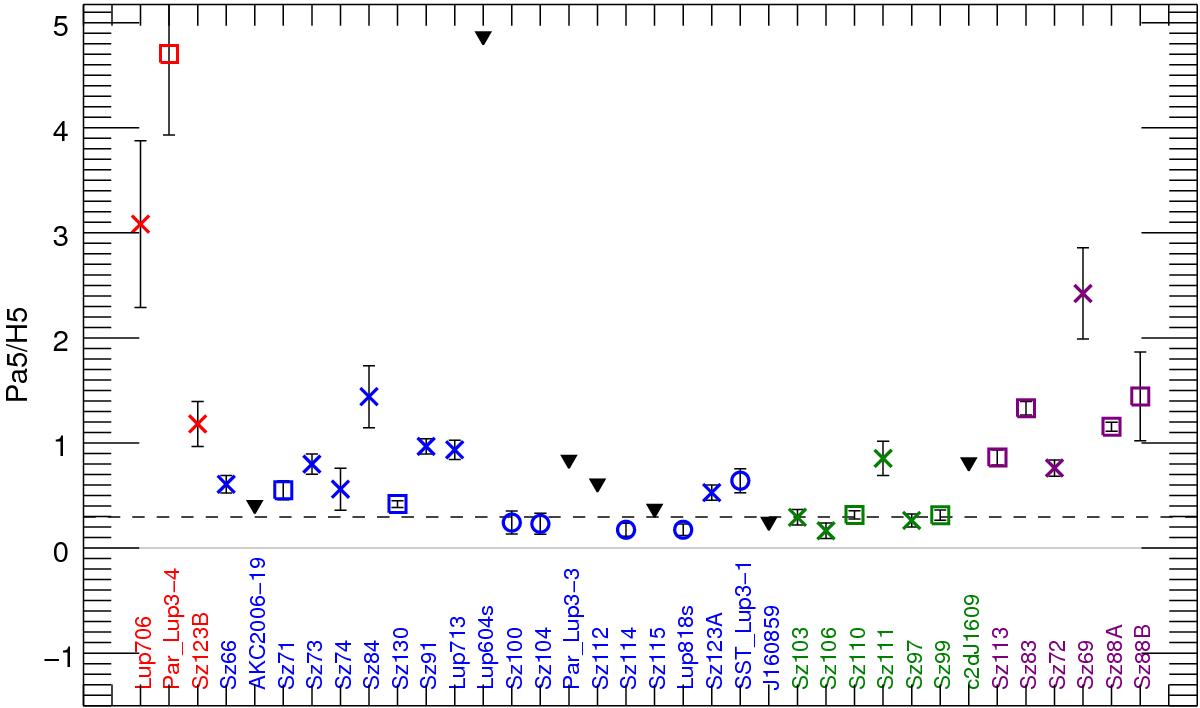
Values of the Pa5/H5 (Paβ/Hγ) in the sample. The expected value for optically thin emission is marked with a dashed horizontal line. The colour marks the Balmer decrement shape type (red:1, blue:2, green:3, purple:4) while the symbol indicates the line profile typology (circle: narrow symmetric, square: wide, cross: multi-peaked); downward triangles are upper limits.
Current usage metrics show cumulative count of Article Views (full-text article views including HTML views, PDF and ePub downloads, according to the available data) and Abstracts Views on Vision4Press platform.
Data correspond to usage on the plateform after 2015. The current usage metrics is available 48-96 hours after online publication and is updated daily on week days.
Initial download of the metrics may take a while.