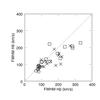
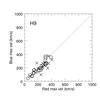
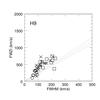
Fig. 5
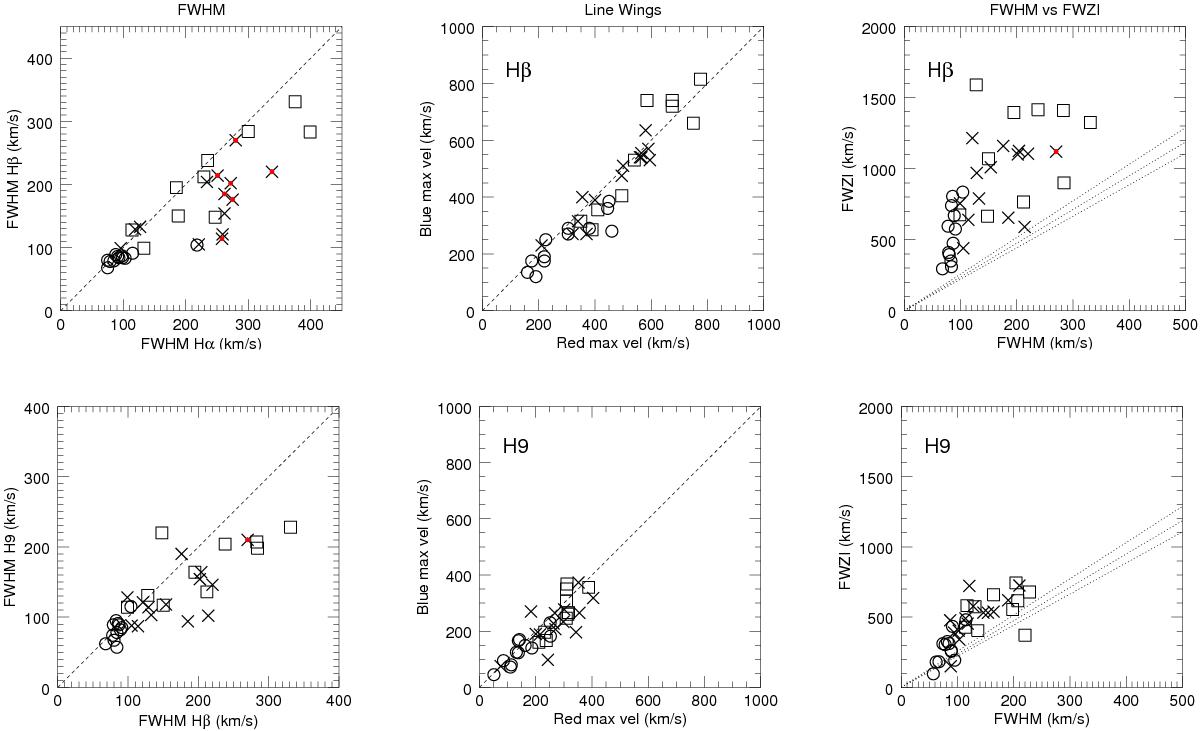
Line widths and velocities for Balmer lines of the Lupus sample. Left panels: FWHM of Hβ versus FWHM of Hα (top); FWHM of H9 versus FWHM of Hβ (bottom). Central panels: red/blue wings extension in Hβ (top) and H9 (bottom). Right panels: FWZI versus FWHM for Hβ (top) and H9 (bottom); dashed lines mark the expected correlation between the FWHM and FWZI (measured at 1/30, 1/50, and 1/100 of the peak) in a Gaussian profile. The different symbols indicate the line profile typology (see Sect. 3.1 and Table 1: narrow symmetric (circles), wide symmetric (squares), and asymmetric or multi-peaked (crosses). Sources where the Hα or Hβ present a particularly deep central absorption, which may introduce a strong bias in the line FWHM measurement (see text), are marked with a red circle.
Current usage metrics show cumulative count of Article Views (full-text article views including HTML views, PDF and ePub downloads, according to the available data) and Abstracts Views on Vision4Press platform.
Data correspond to usage on the plateform after 2015. The current usage metrics is available 48-96 hours after online publication and is updated daily on week days.
Initial download of the metrics may take a while.