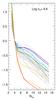
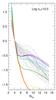
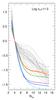
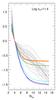
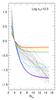
Fig. 11
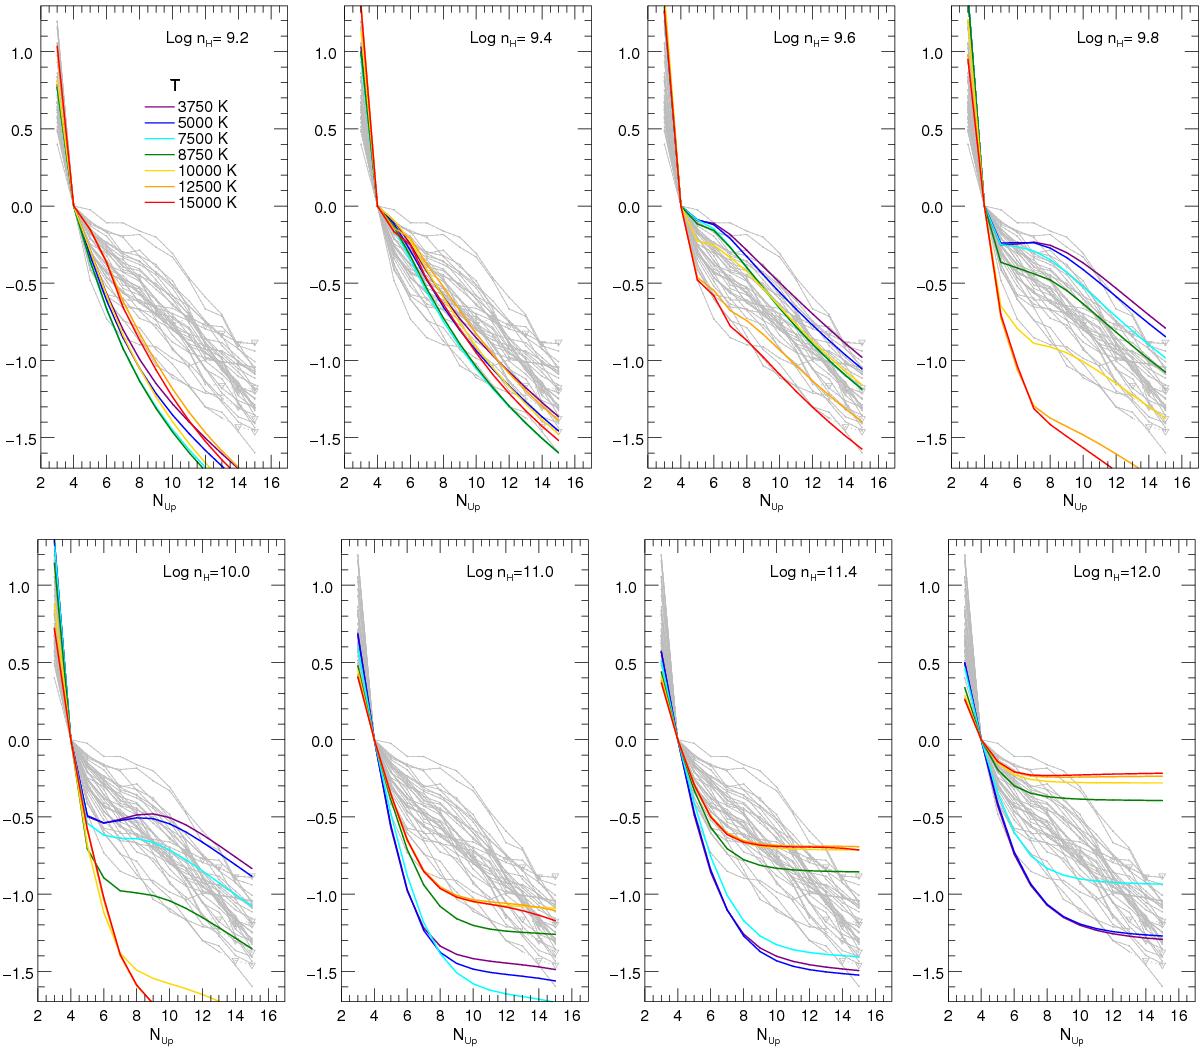
Balmer decrements predicted by the local line excitation calculations of Kwan & Fischer (2011) are superposed on the decrements observed in our sample (grey lines). The panels display results for different values of the hydrogen number density nH (indicated), while the solid lines of different colours refer to the gas temperatures reported in the legend.
Current usage metrics show cumulative count of Article Views (full-text article views including HTML views, PDF and ePub downloads, according to the available data) and Abstracts Views on Vision4Press platform.
Data correspond to usage on the plateform after 2015. The current usage metrics is available 48-96 hours after online publication and is updated daily on week days.
Initial download of the metrics may take a while.