Free Access
Fig. 10
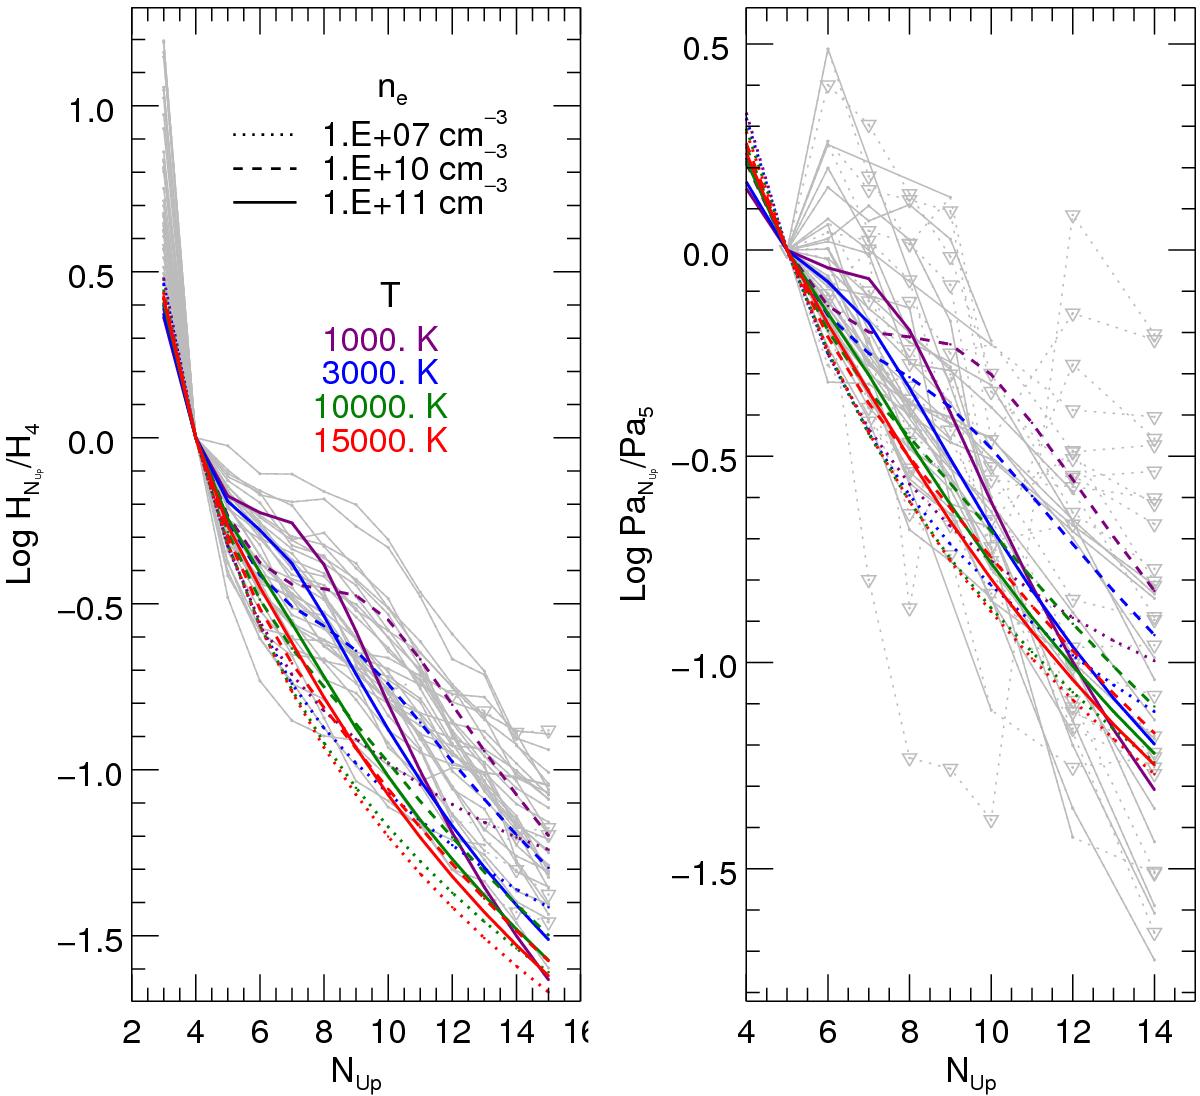
Case B model Balmer (left) and Paschen (right) decrements are superposed to the observed decrements of our sample (grey lines). The various colours and line styles refer to different gas parameters, as indicated in the legend in the left panel.
This figure is made of several images, please see below:
Current usage metrics show cumulative count of Article Views (full-text article views including HTML views, PDF and ePub downloads, according to the available data) and Abstracts Views on Vision4Press platform.
Data correspond to usage on the plateform after 2015. The current usage metrics is available 48-96 hours after online publication and is updated daily on week days.
Initial download of the metrics may take a while.