Free Access
Fig. 6
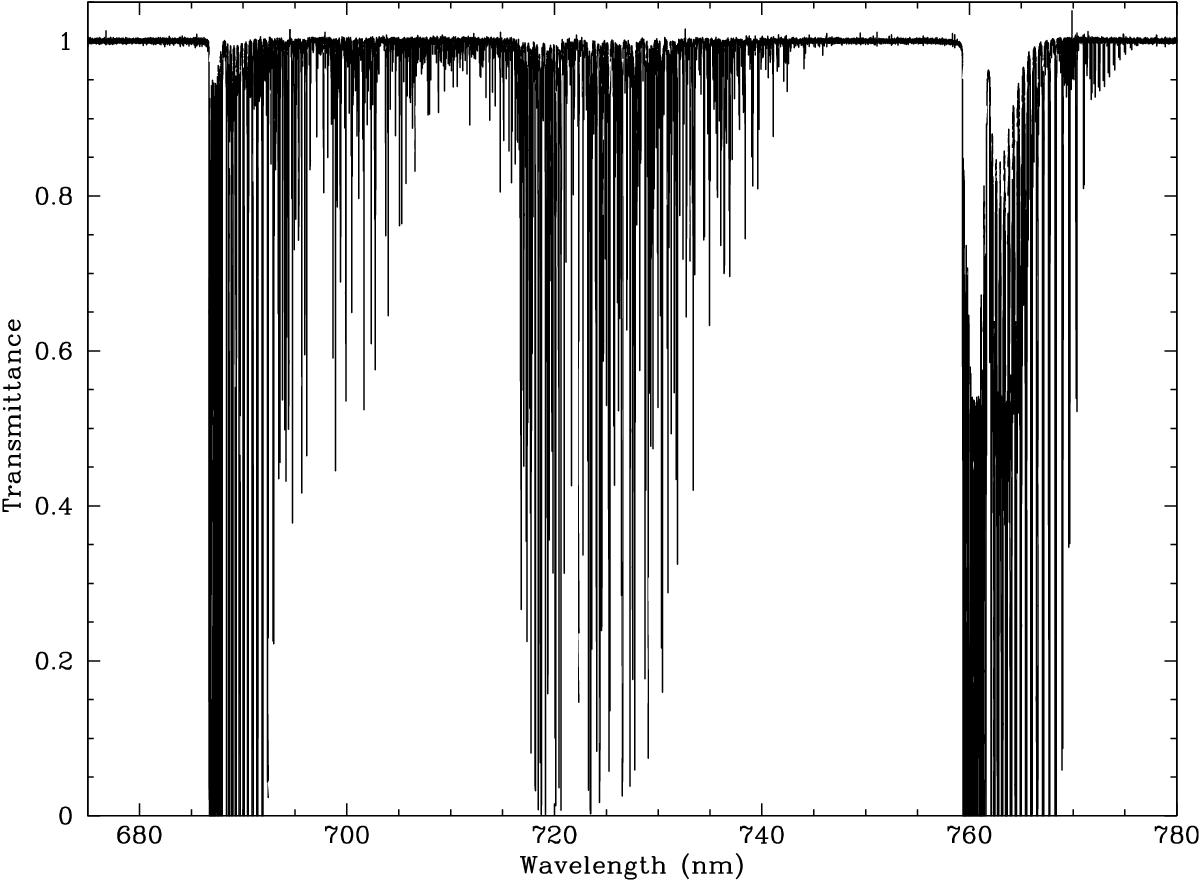
High-resolution telluric absorption spectrum in the 680–780 nm wavelength region (from Hinkle et al. 2003). Three prominent molecular bands can be seen: the oxygen B- and A-bands at 686 and 760 nm, as well as water vapour at 717 nm.
Current usage metrics show cumulative count of Article Views (full-text article views including HTML views, PDF and ePub downloads, according to the available data) and Abstracts Views on Vision4Press platform.
Data correspond to usage on the plateform after 2015. The current usage metrics is available 48-96 hours after online publication and is updated daily on week days.
Initial download of the metrics may take a while.